New York Sports Science Lab
Freelance project focusing on data visualizations and analytics for a sports science company
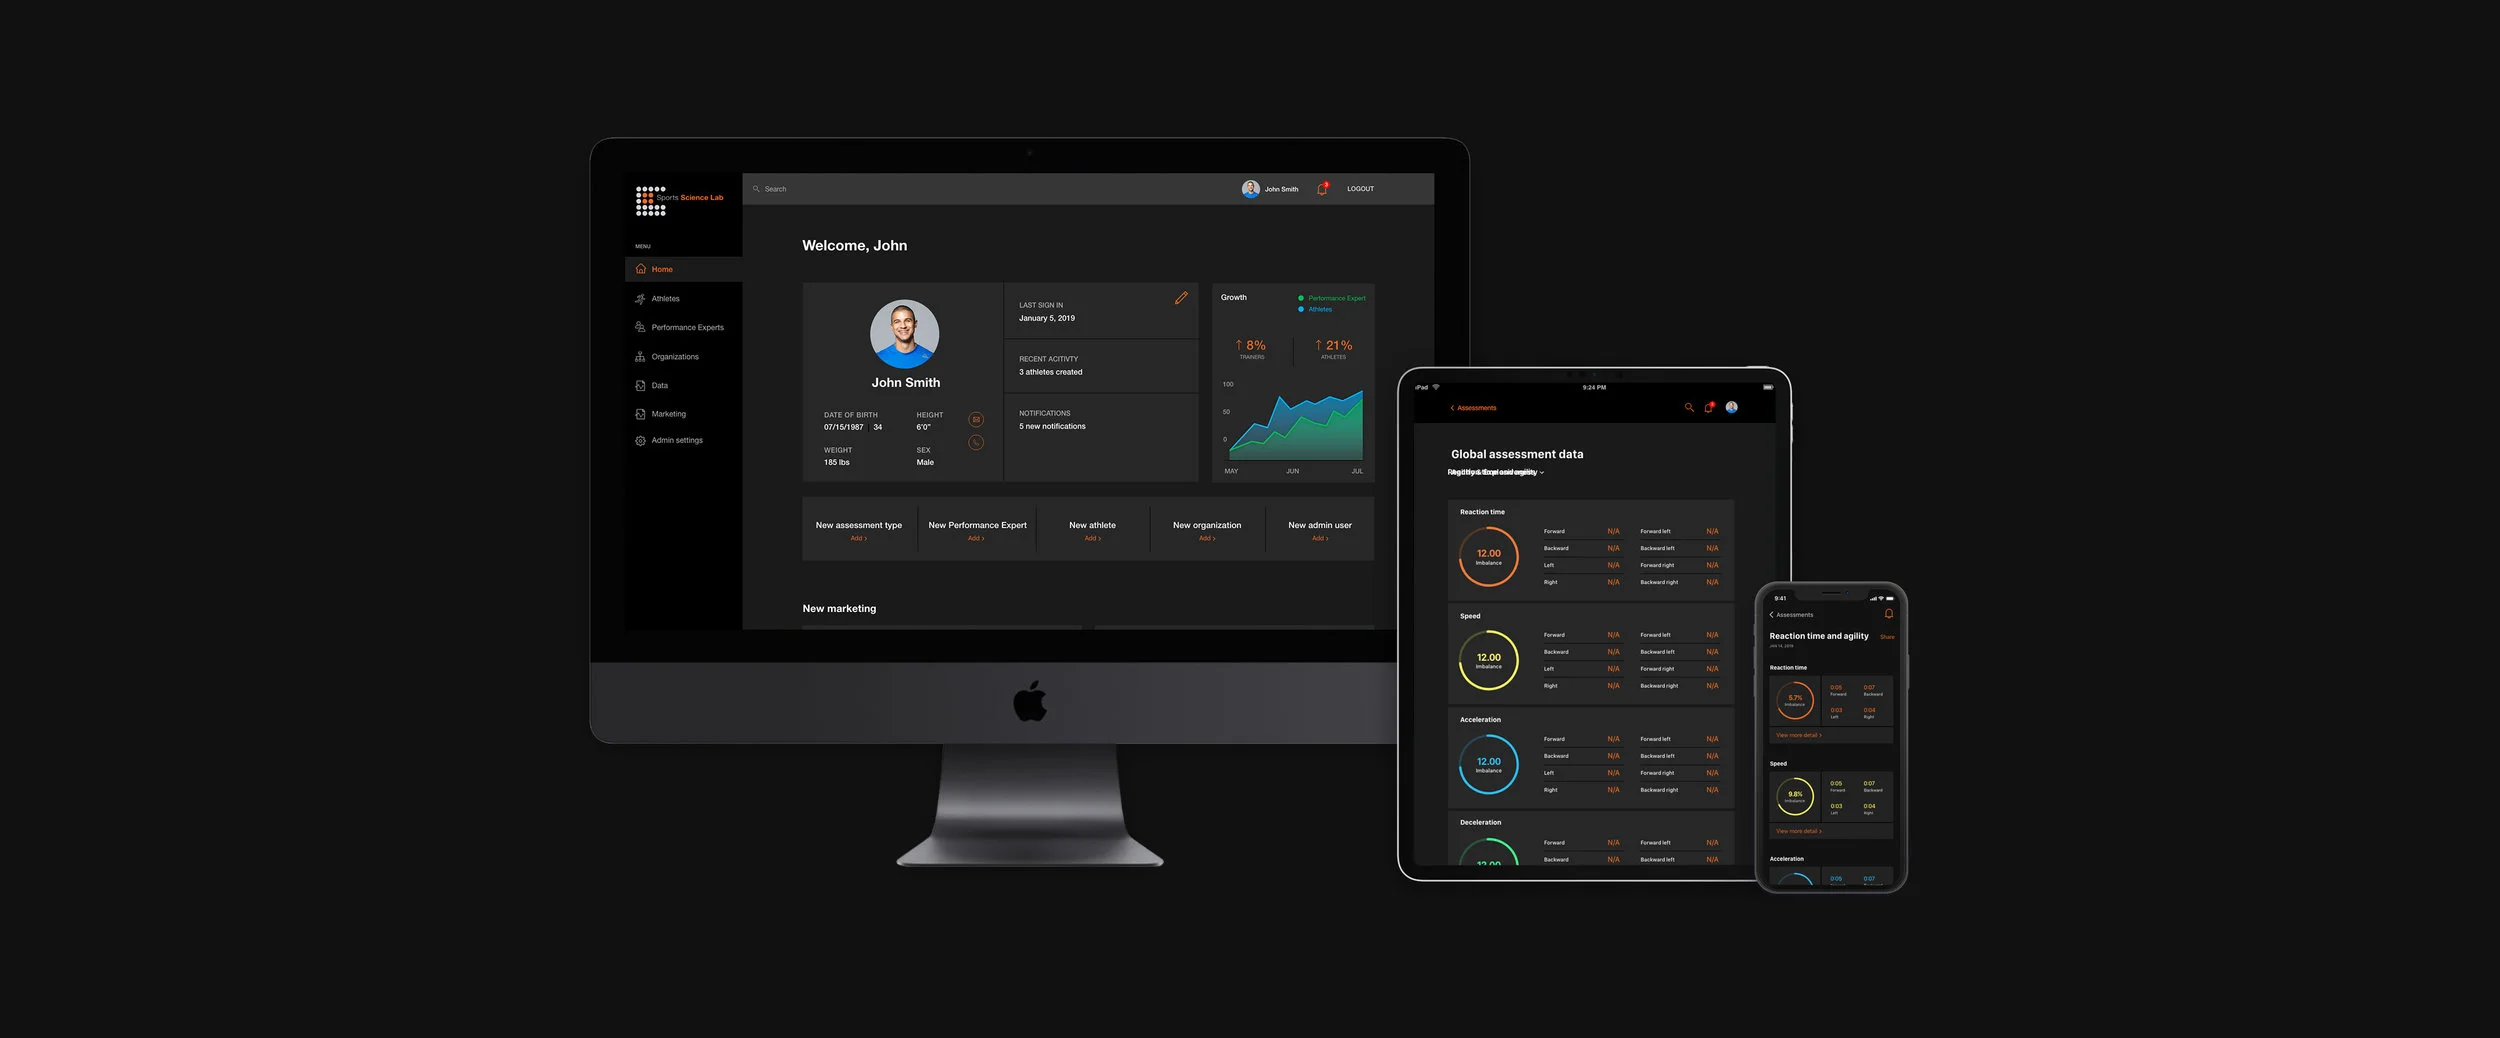
The creation of a desktop admin panel, an internal company app for the Performance Experts, and an external app where the athletes can view their assessment data and progress. I was tasked with creating both apps simultaneously in addition to the admin panel.
My Role
Creative Director, UX/UI Designer, Visual Designer, and Content Strategist; Developed and maintained a design language across three products; Worked with NYSSL Engineer and developer to solidify design ideas and ensure proper functionality.
Results
Created three new experiences for New York Sports Science Lab; Engaging experiences that allow the admin, Performance Experts, and athletes to understand data and the comparison of data points for each athlete.
Timeline
3 months
Client
New York Sports Science Lab
Problem
NYSSL did not have an existing admin panel, internal, or external app. The athlete was not able to see their assessment data or performance metrics, which help measure progress.
Project Goals
Create an admin panel, an internal app to allow NYSSL Performance Experts to upload assessment and training data to the database, and an external app to display both an athlete’s assessment and daily training data.
Process
I gathered information about how the admin panel, internal, and external apps would be used. I created personas for each application and combed through all spreadsheets to understand the data and what needed to be displayed. I presented multiple options of how data could be displayed.
Admin experience
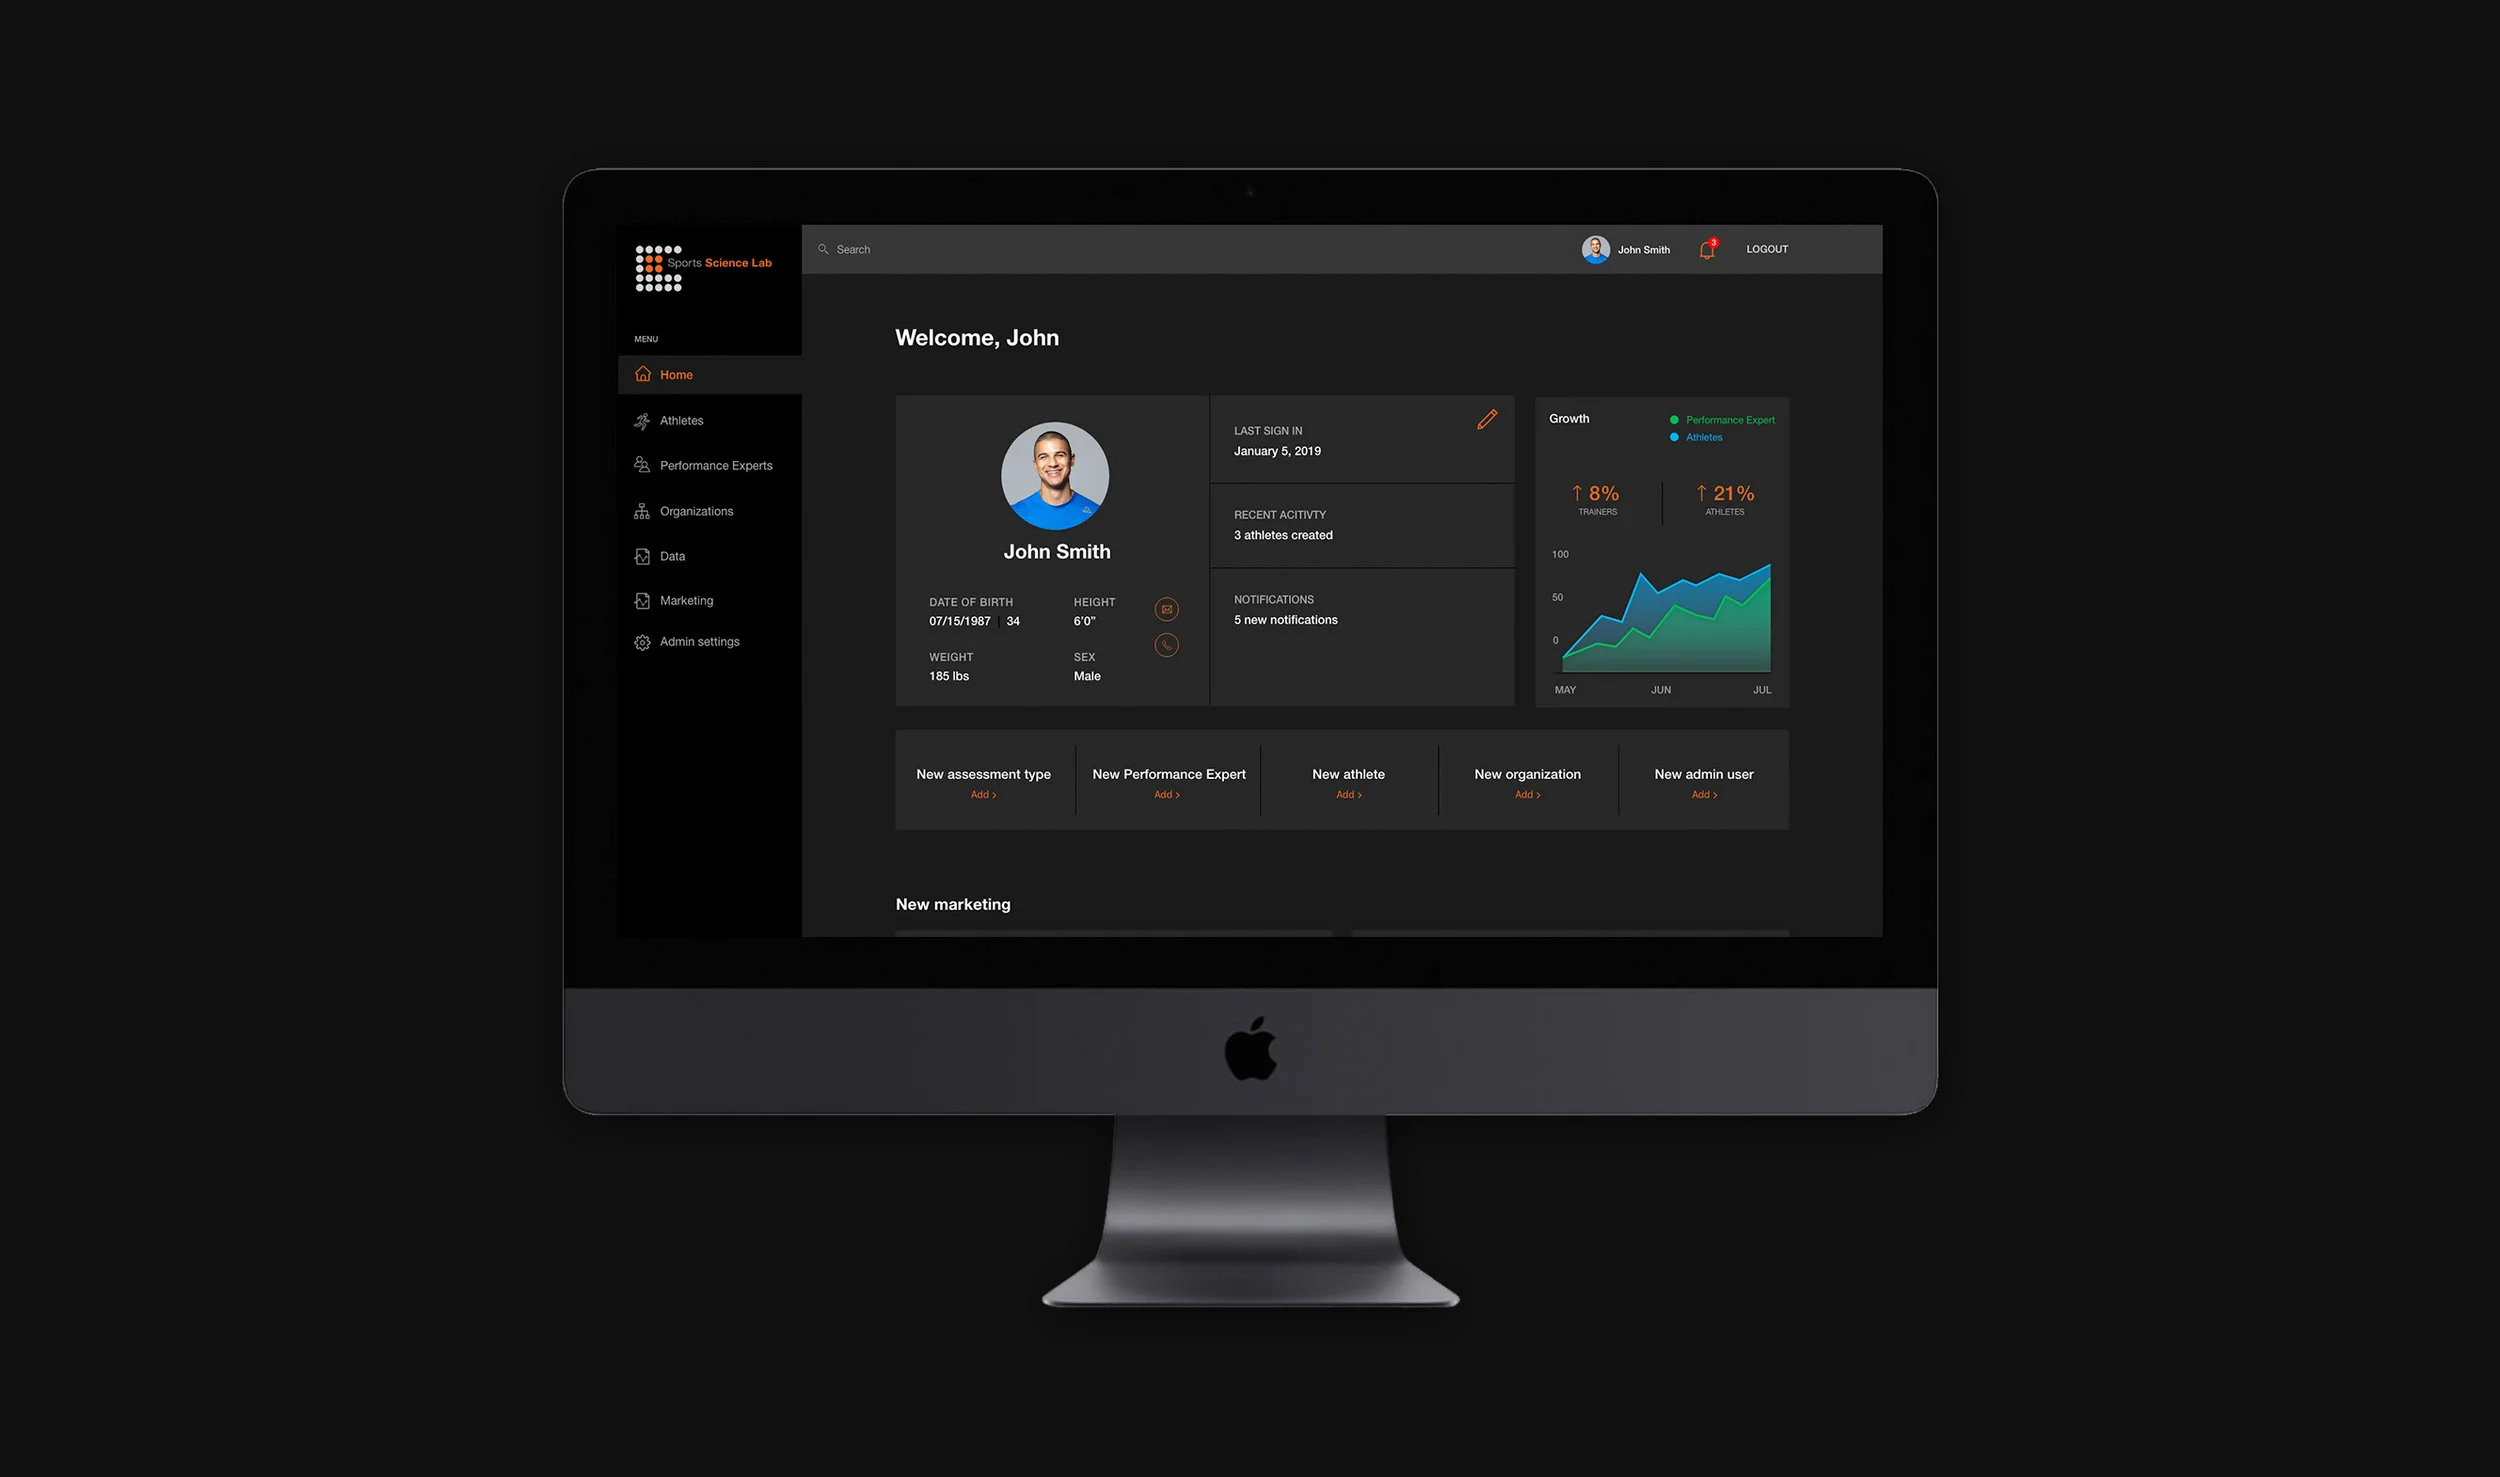
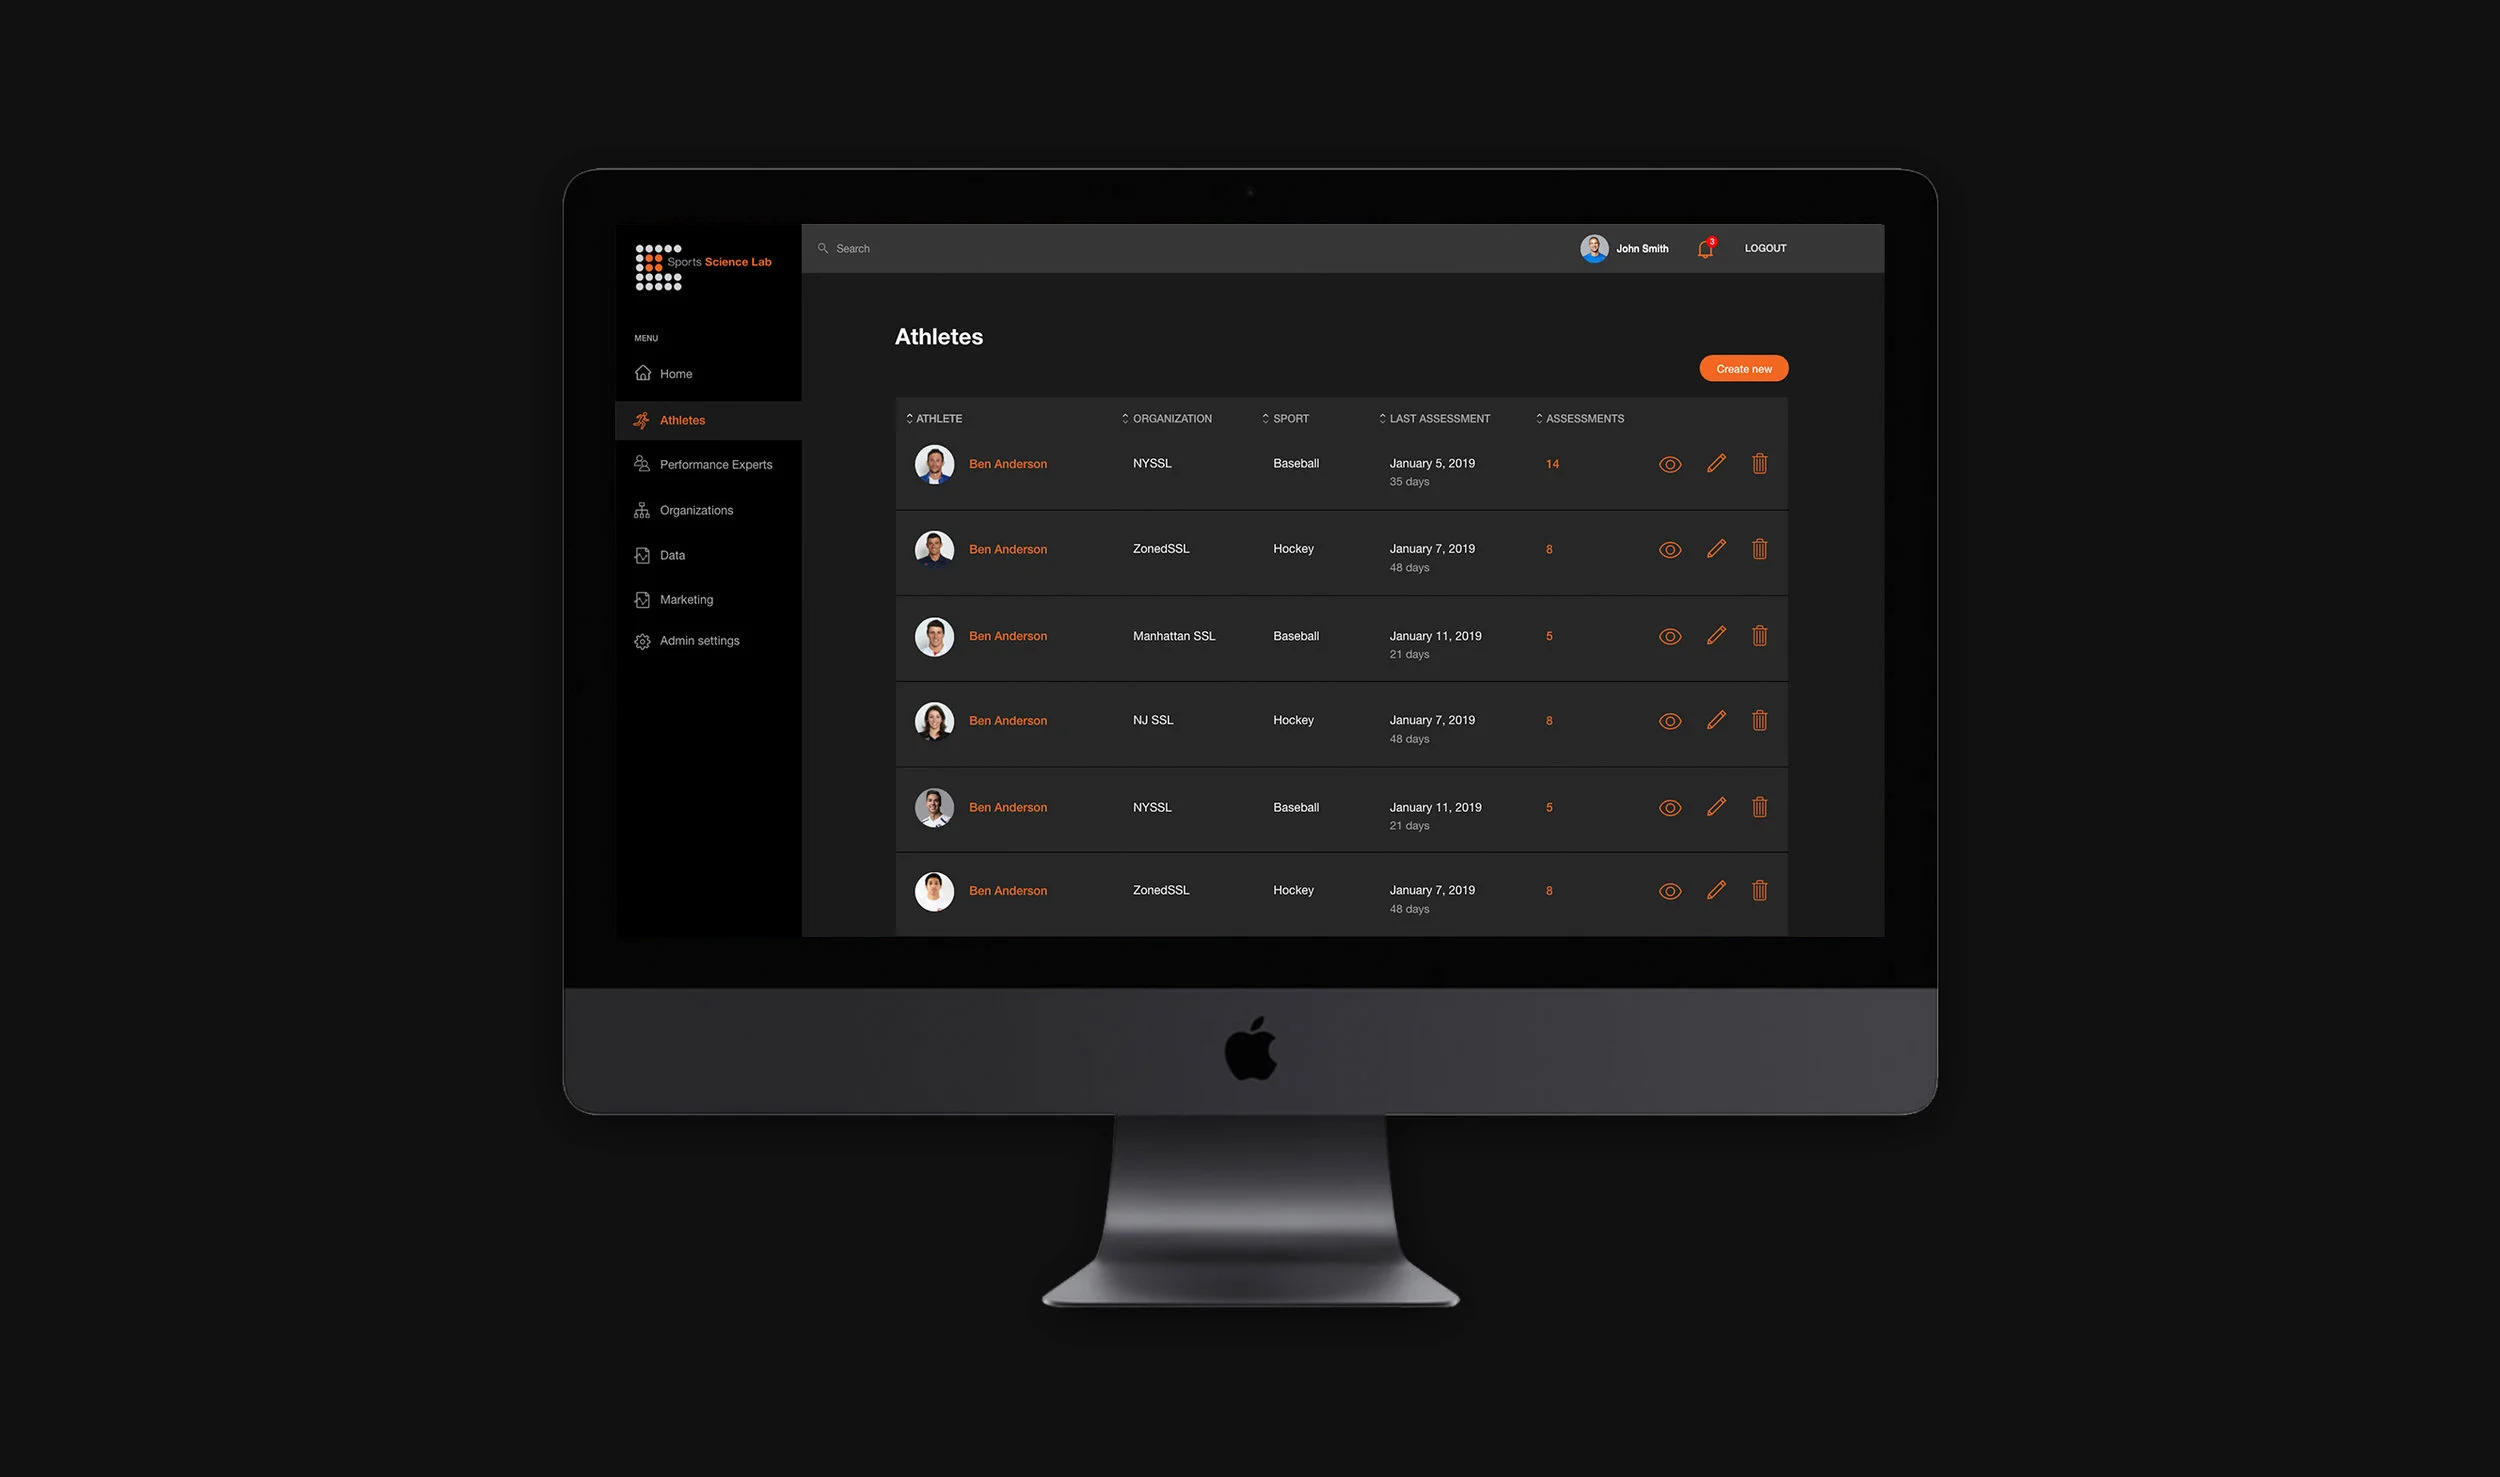
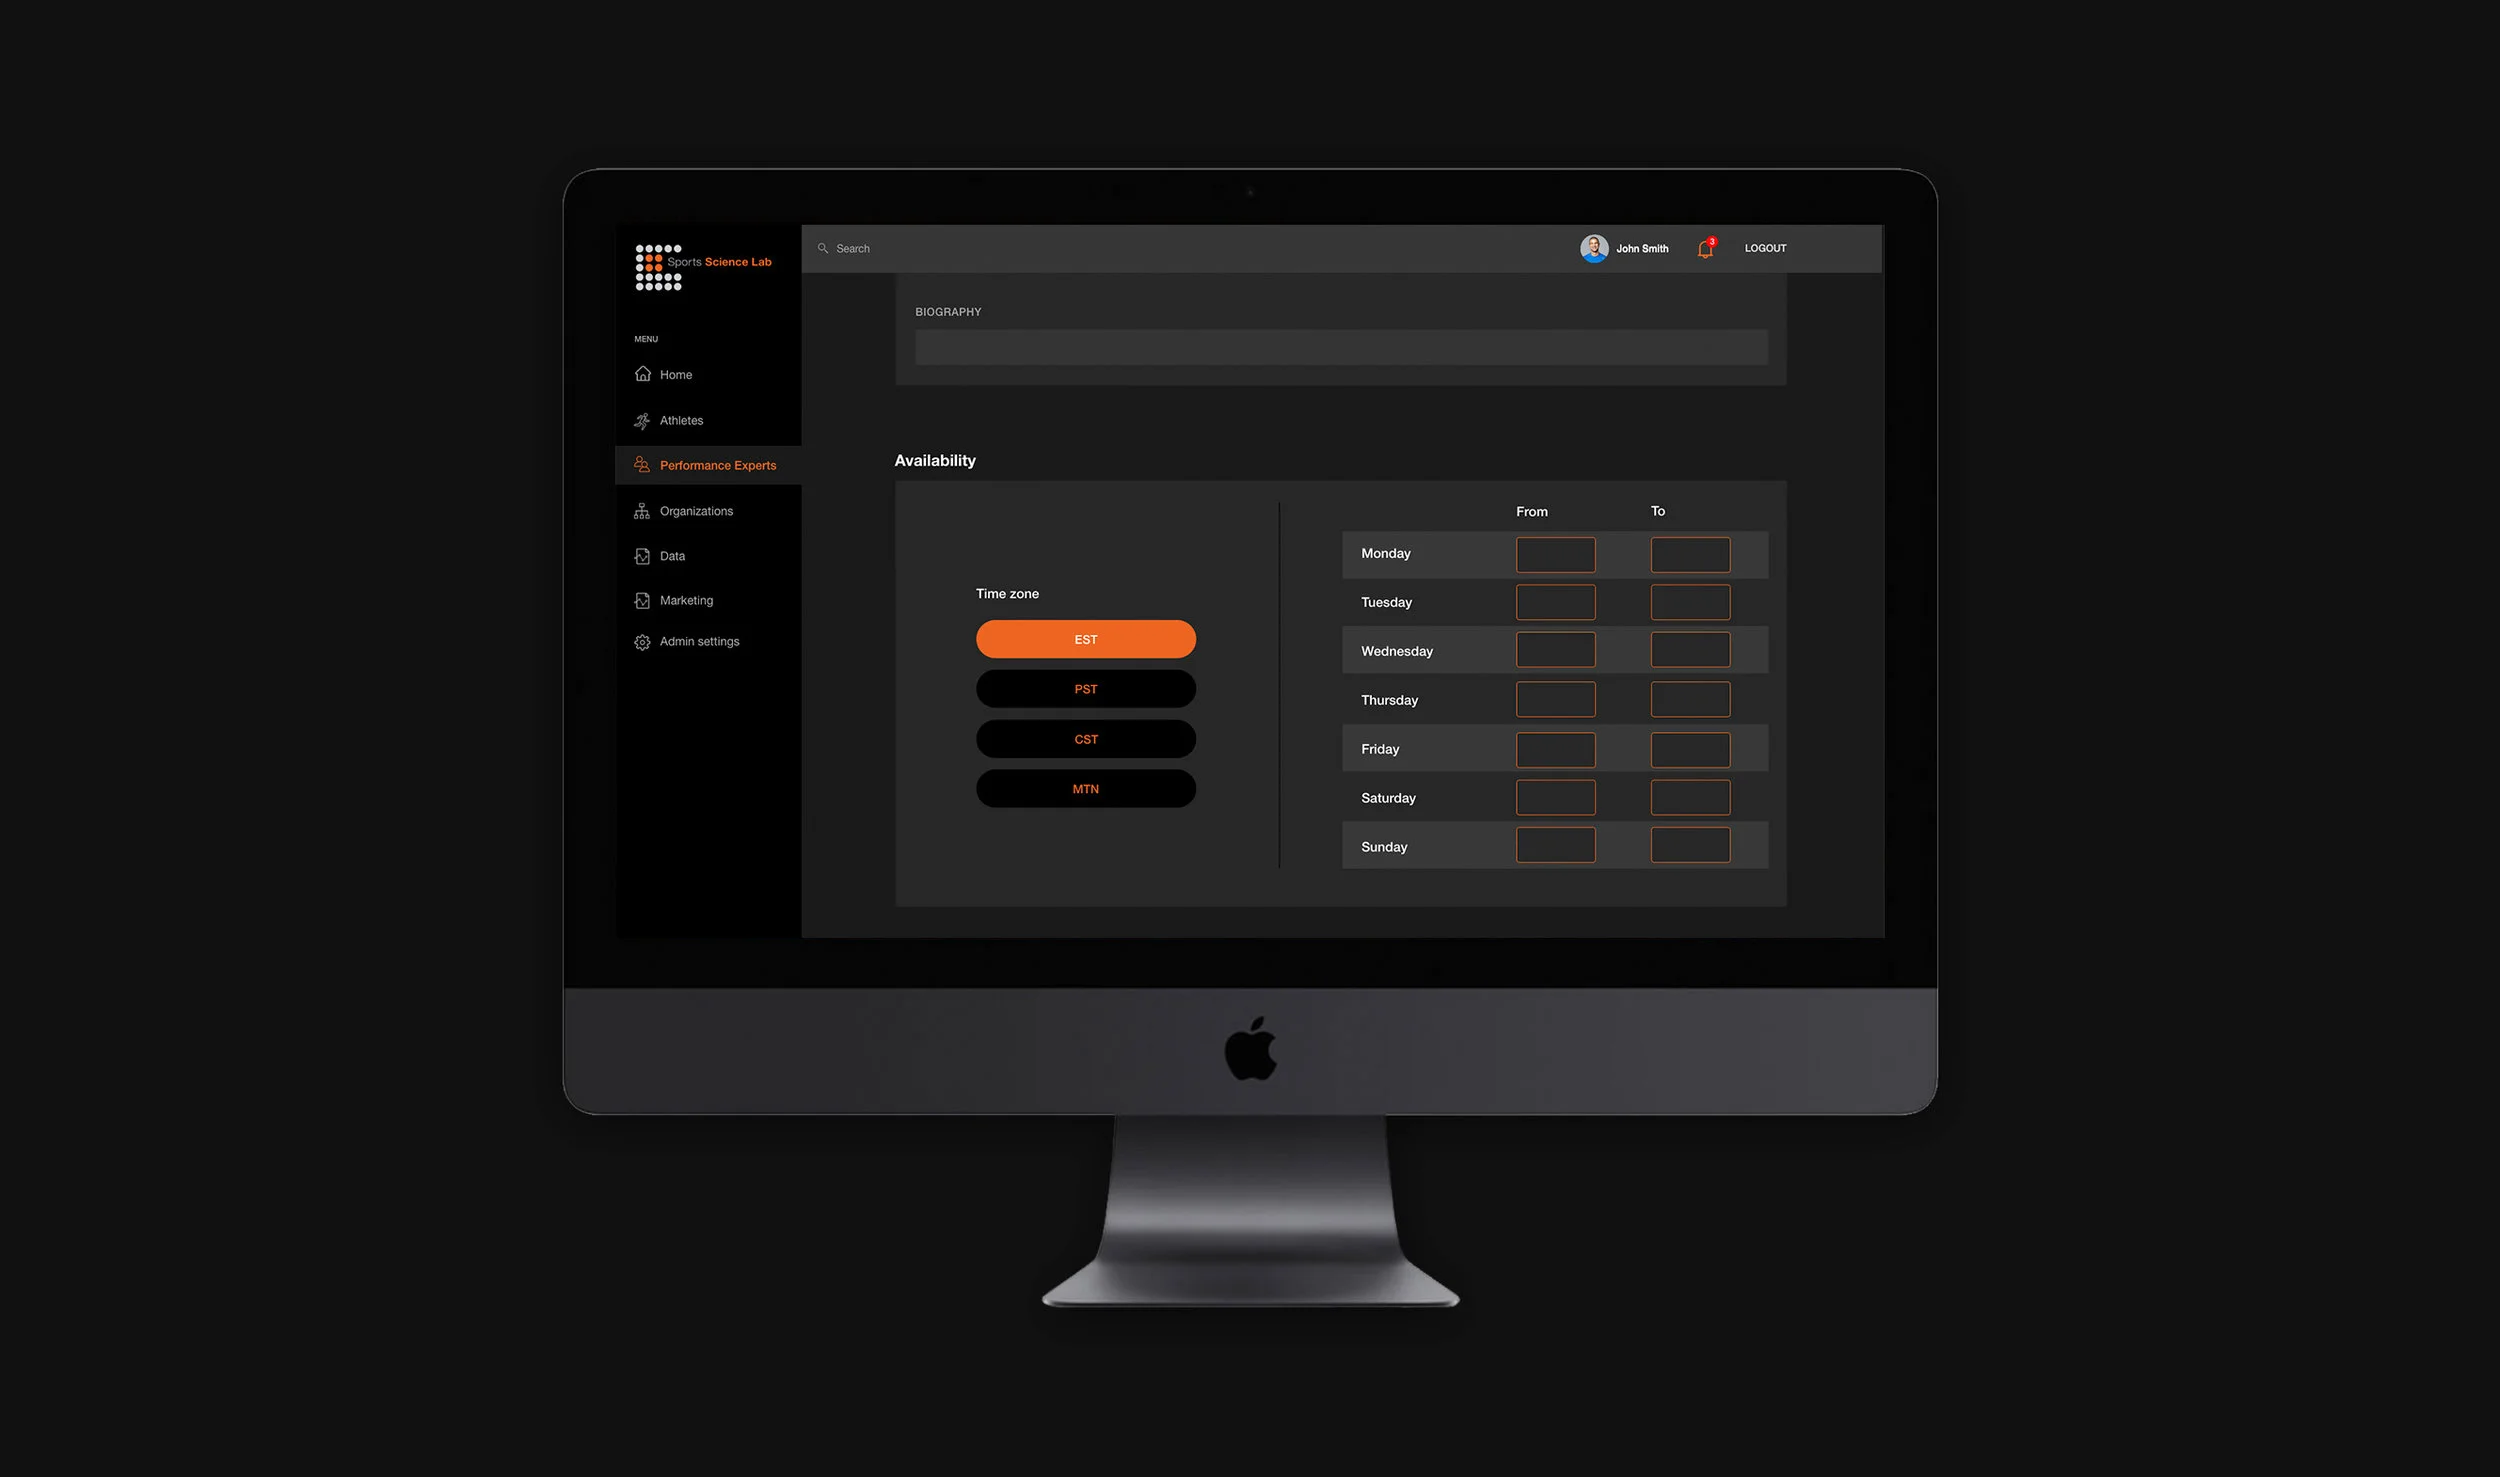
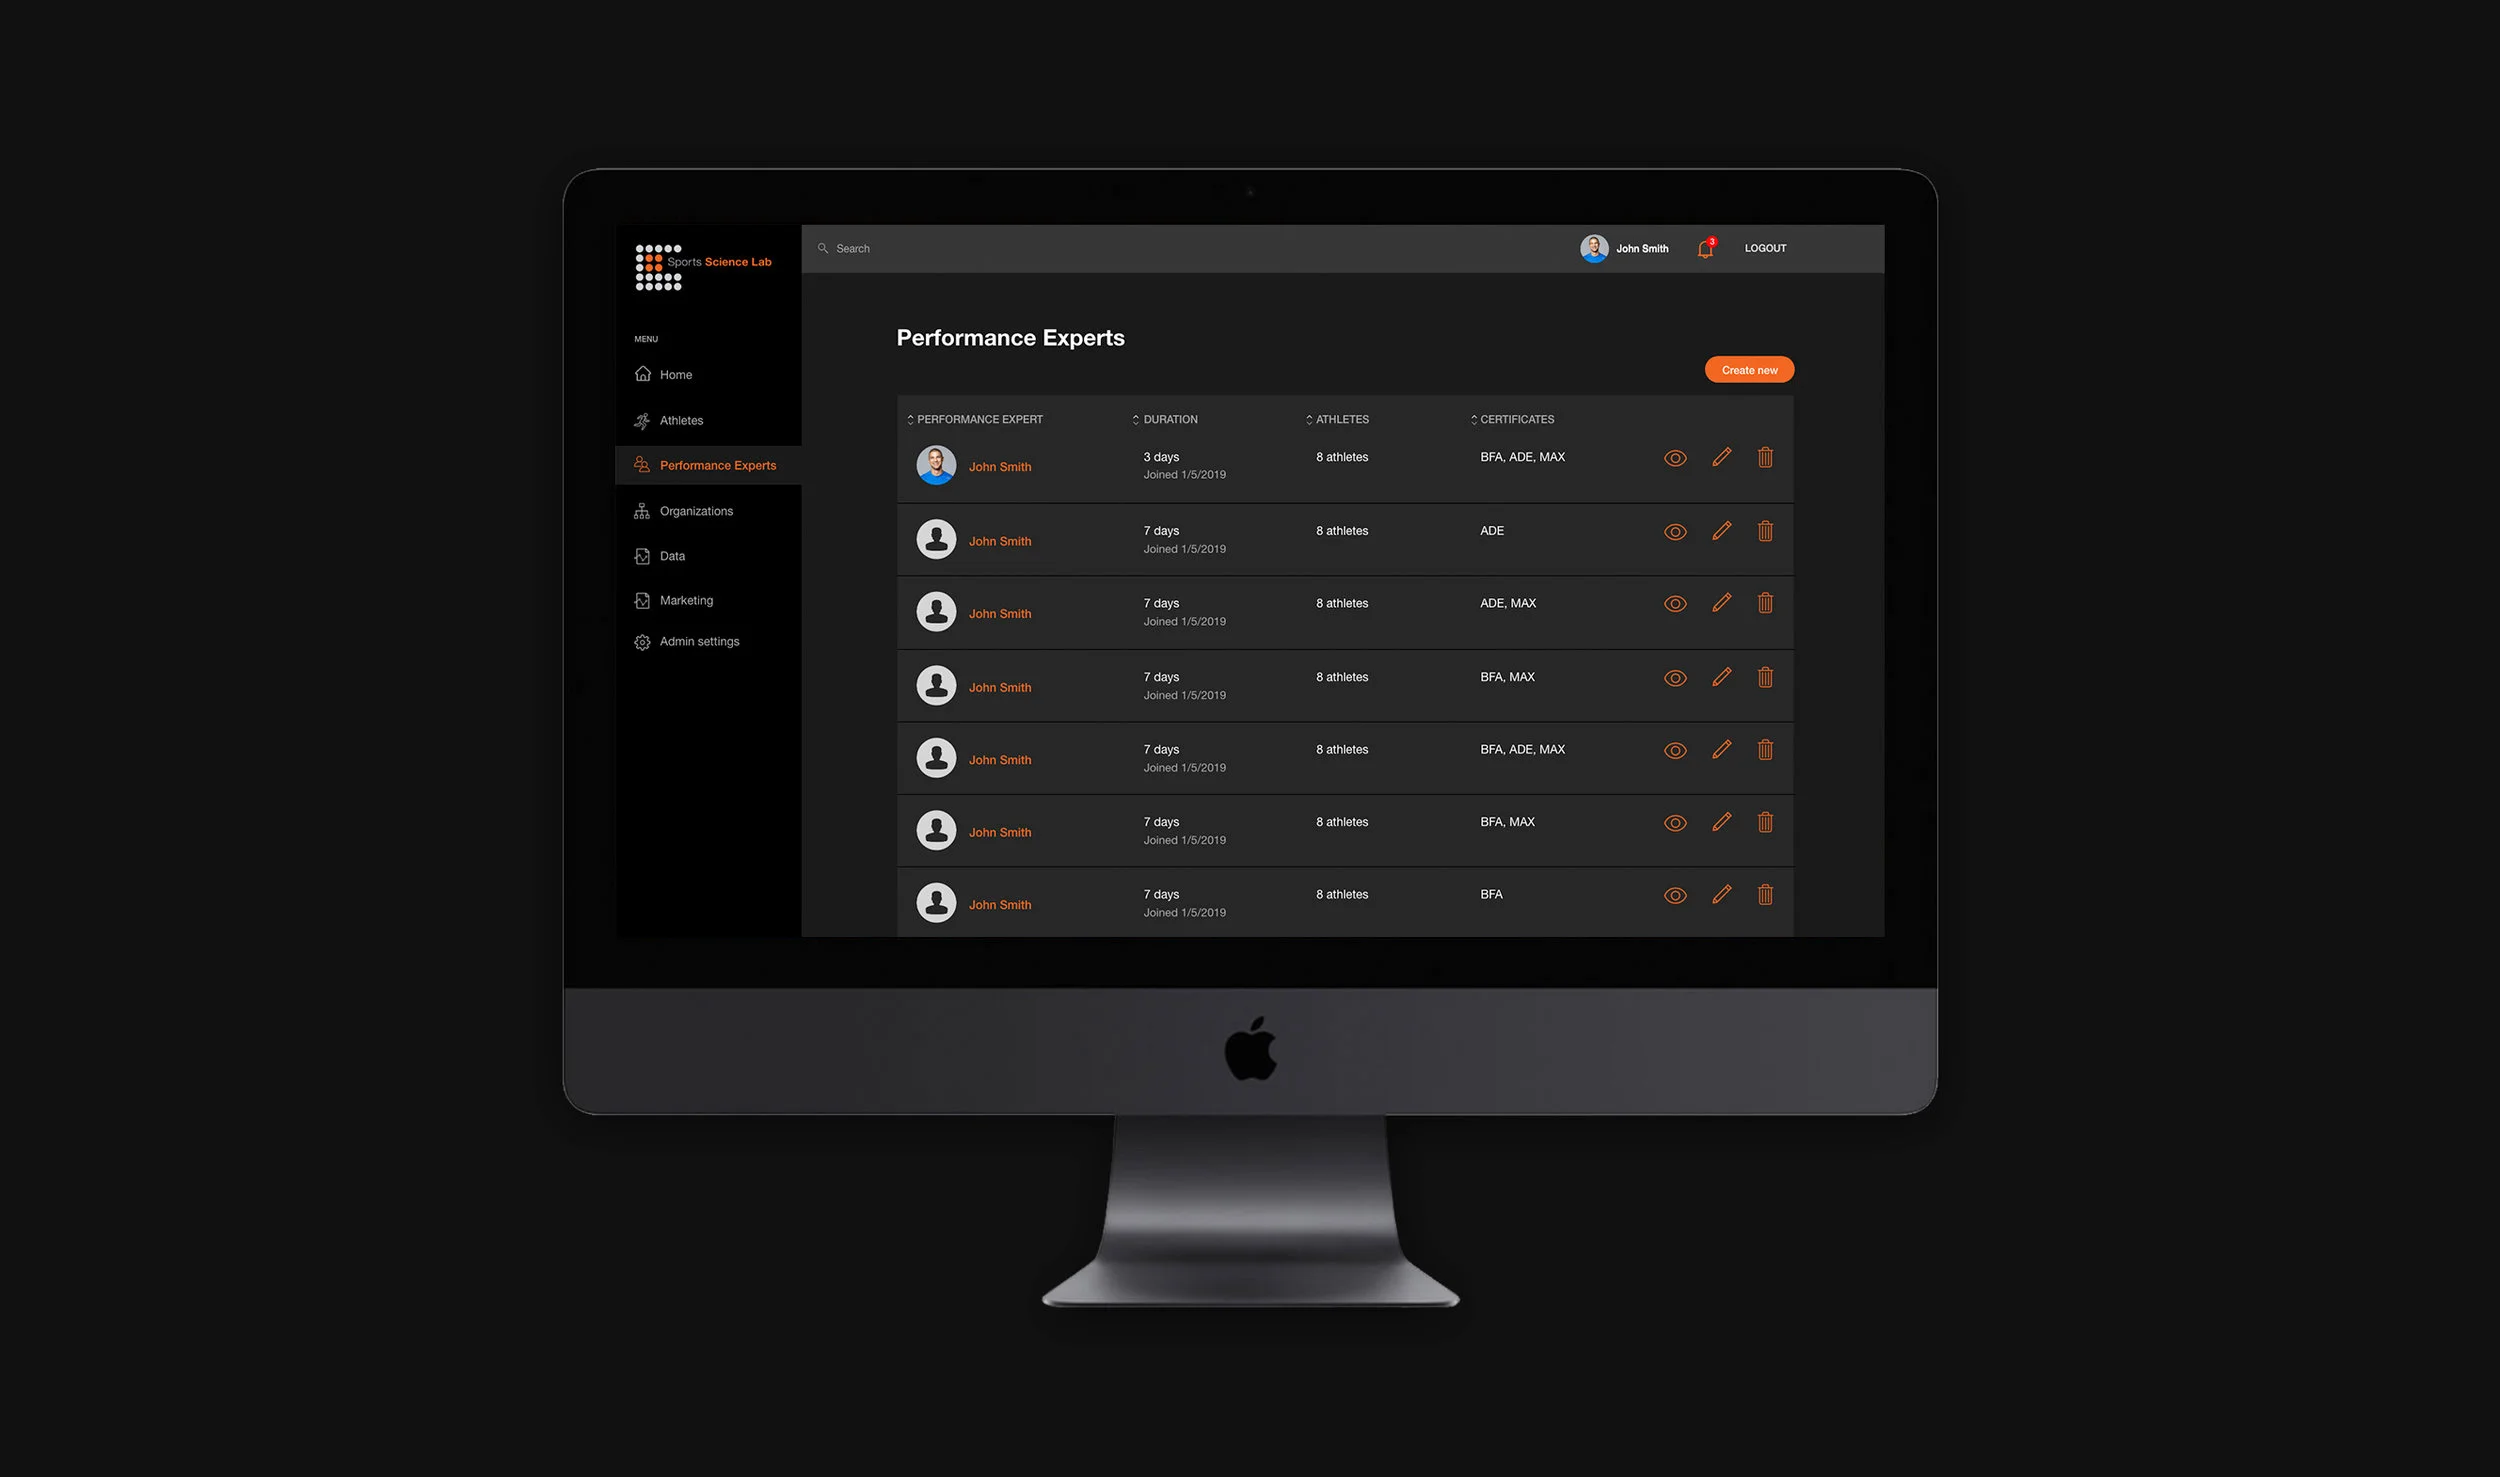
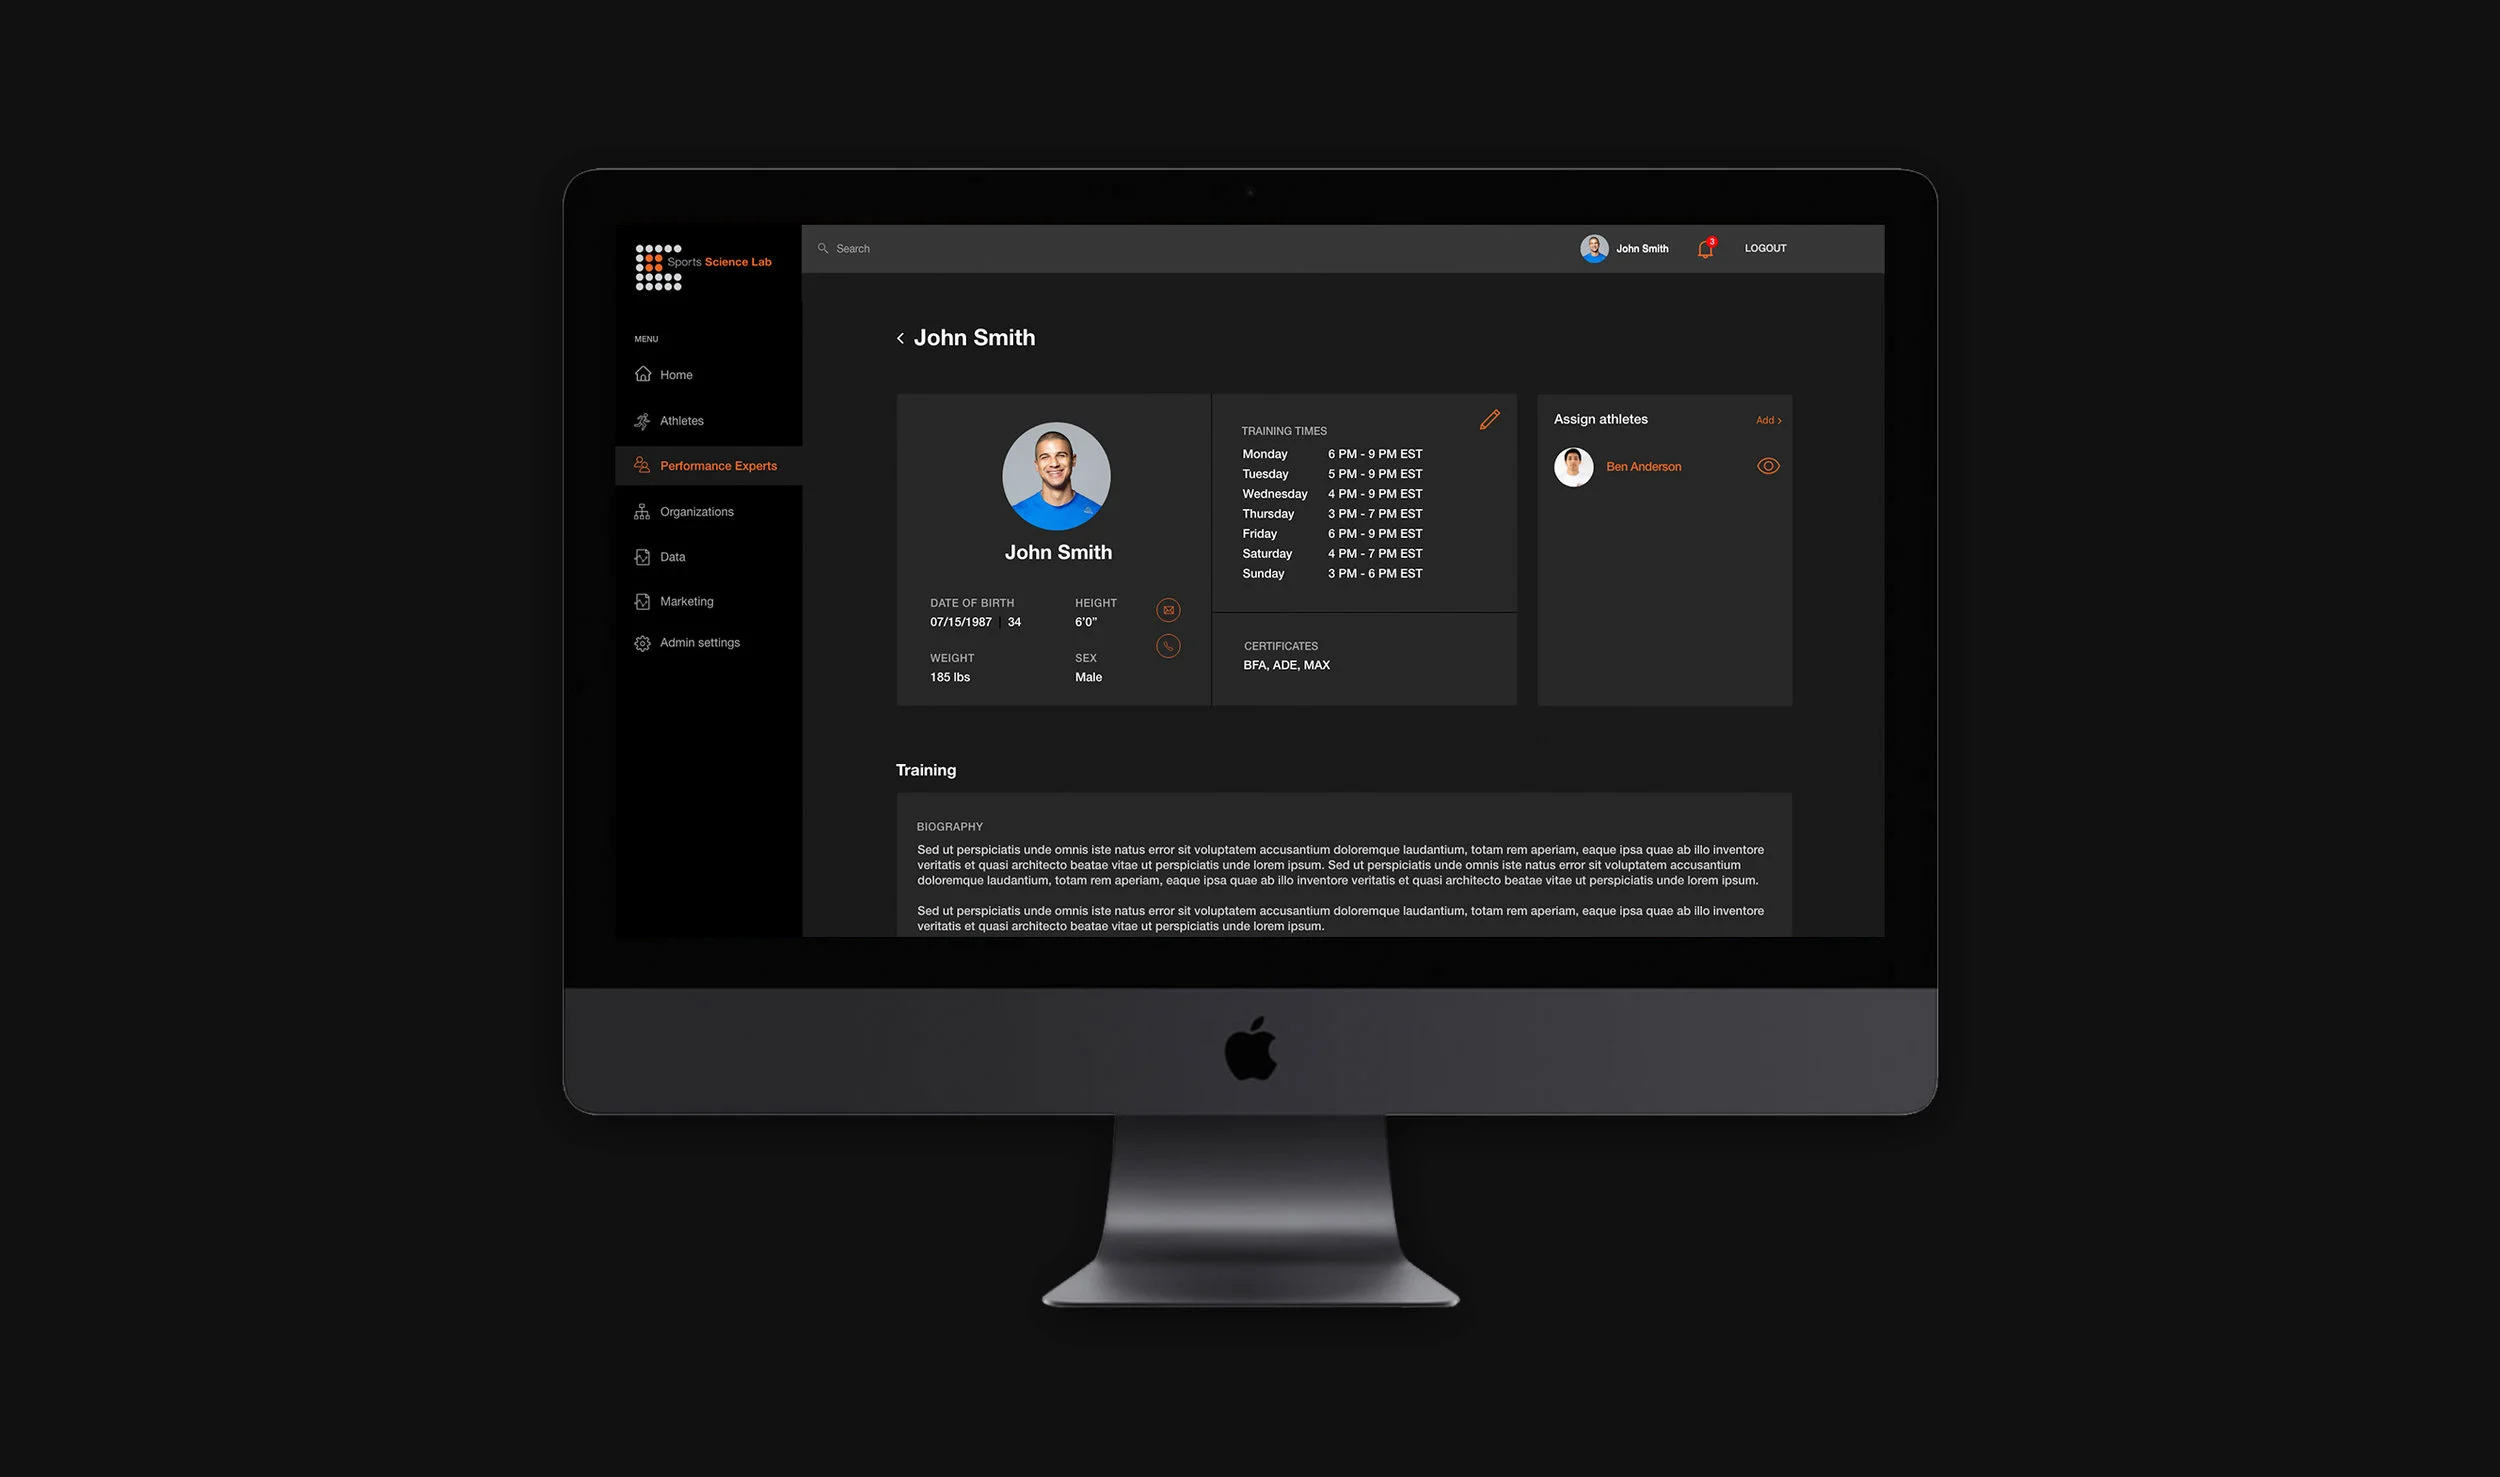
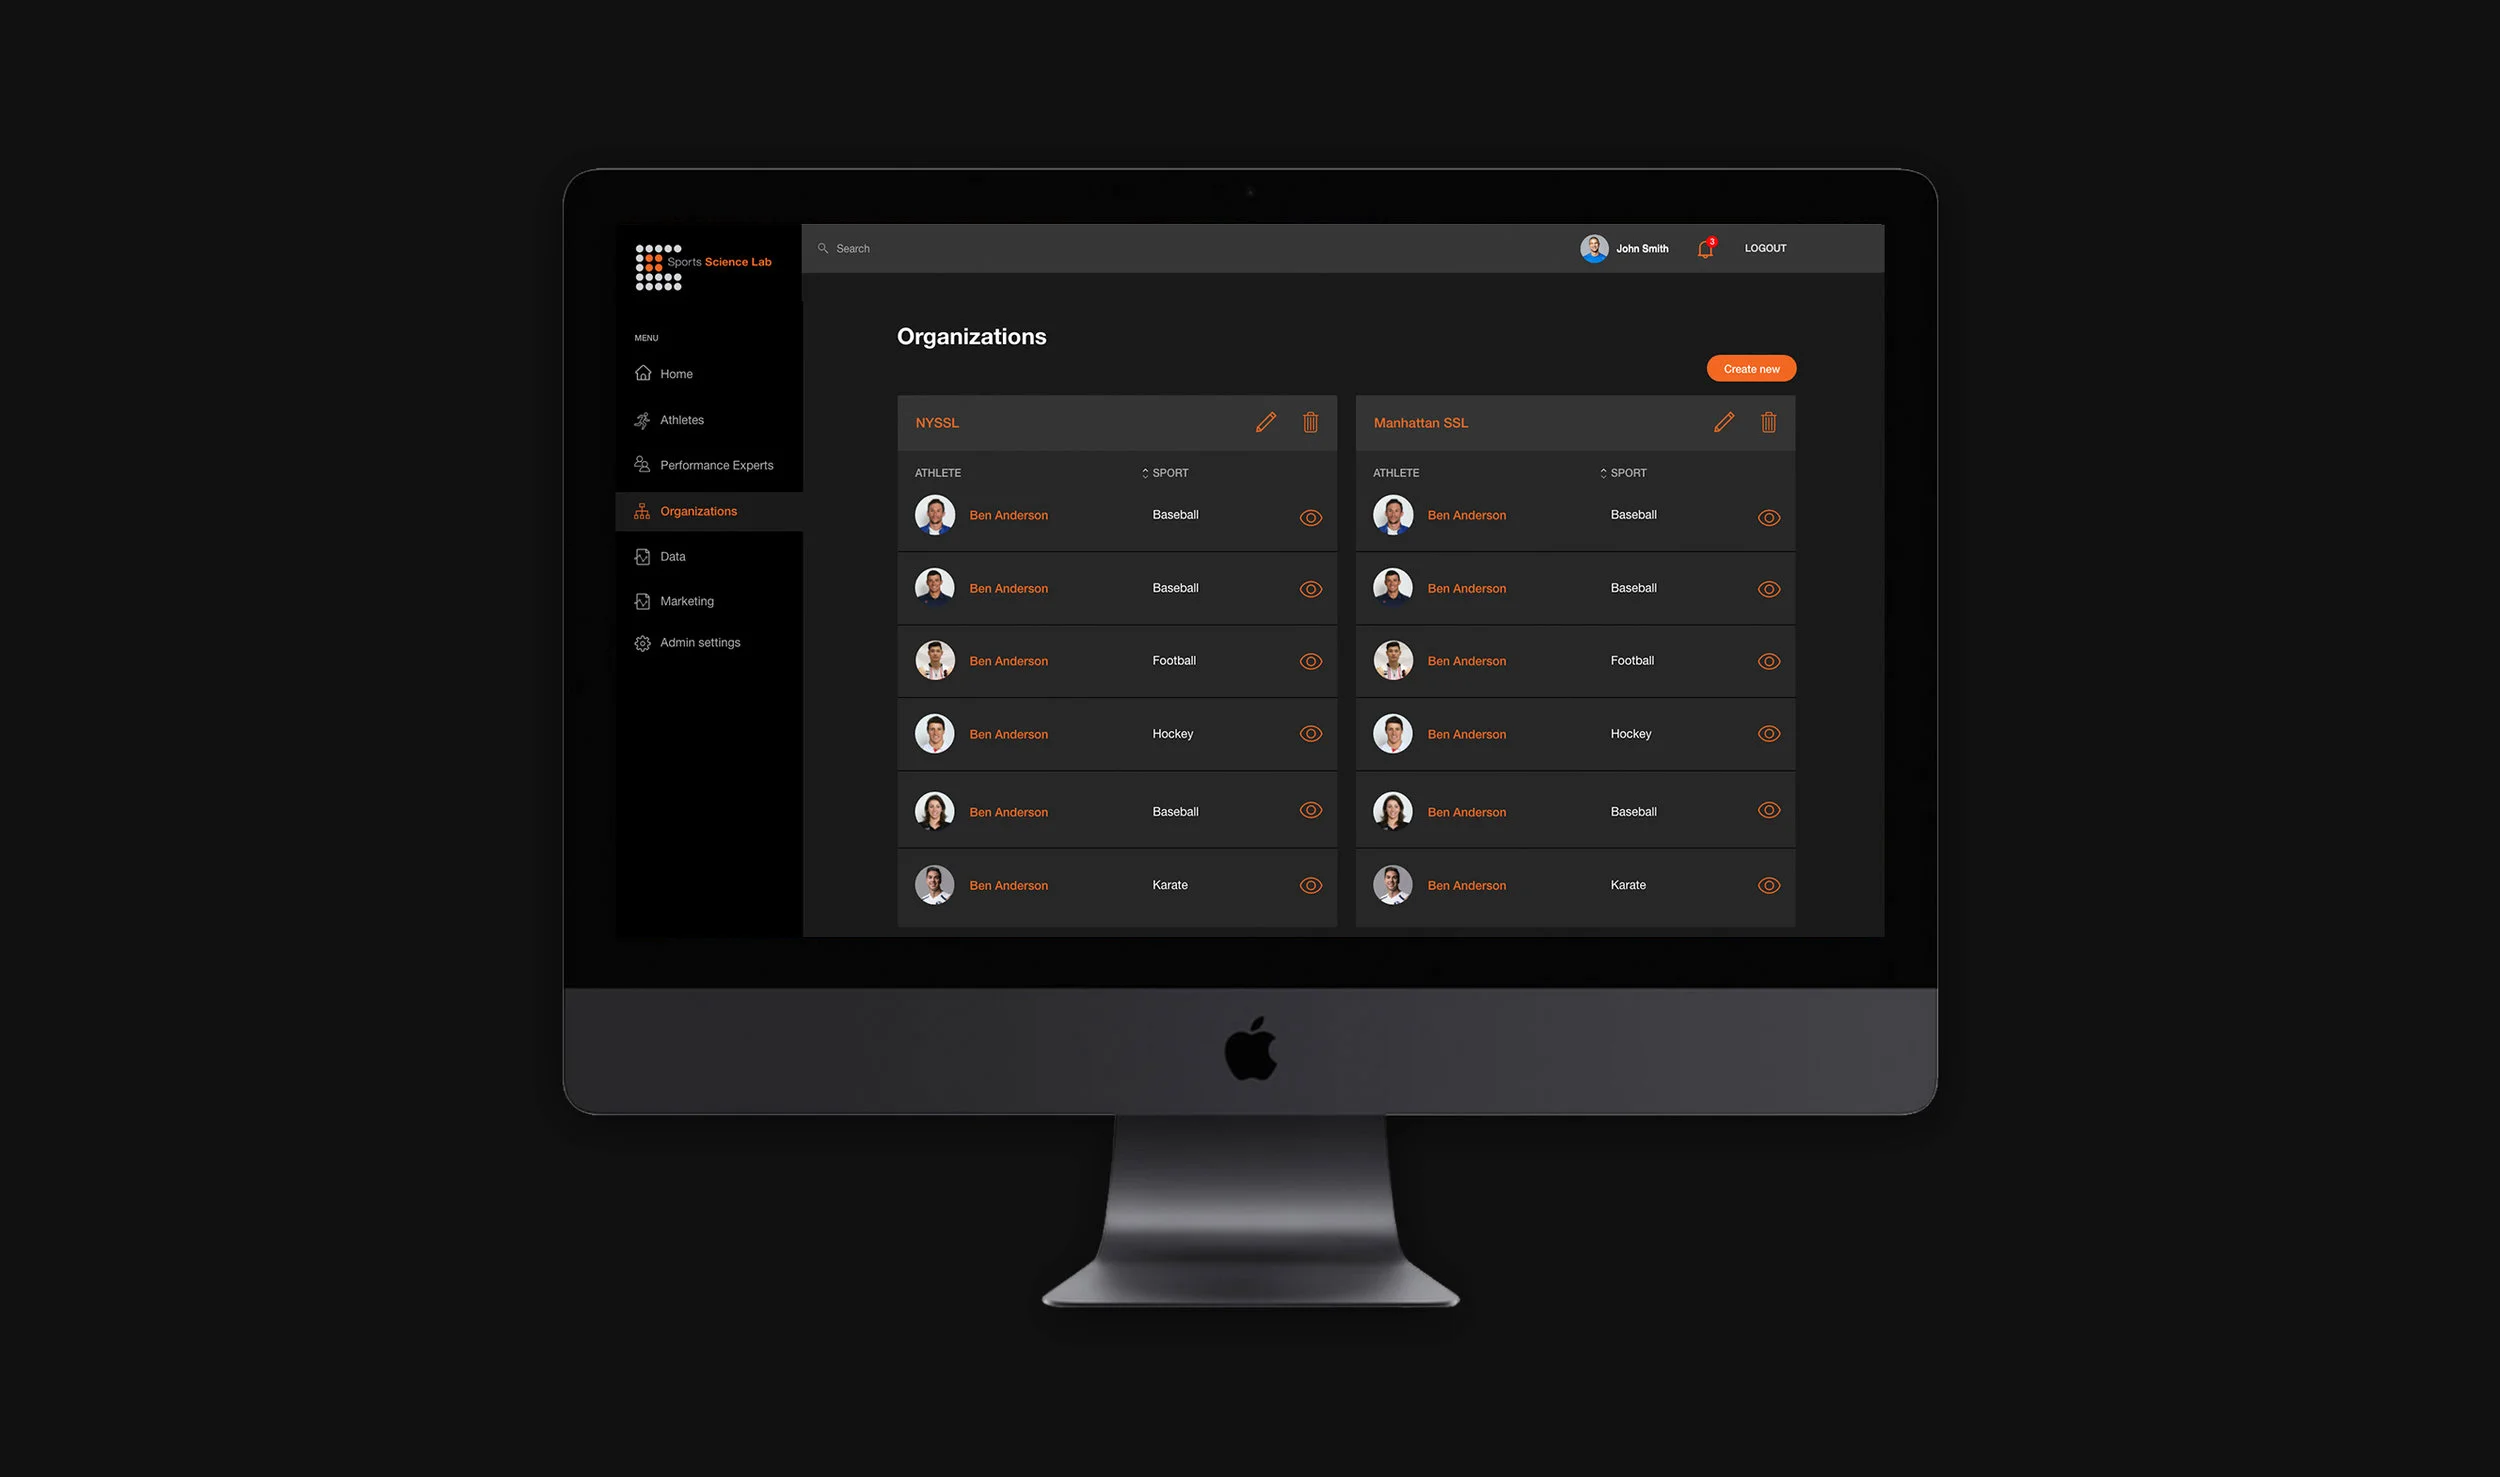
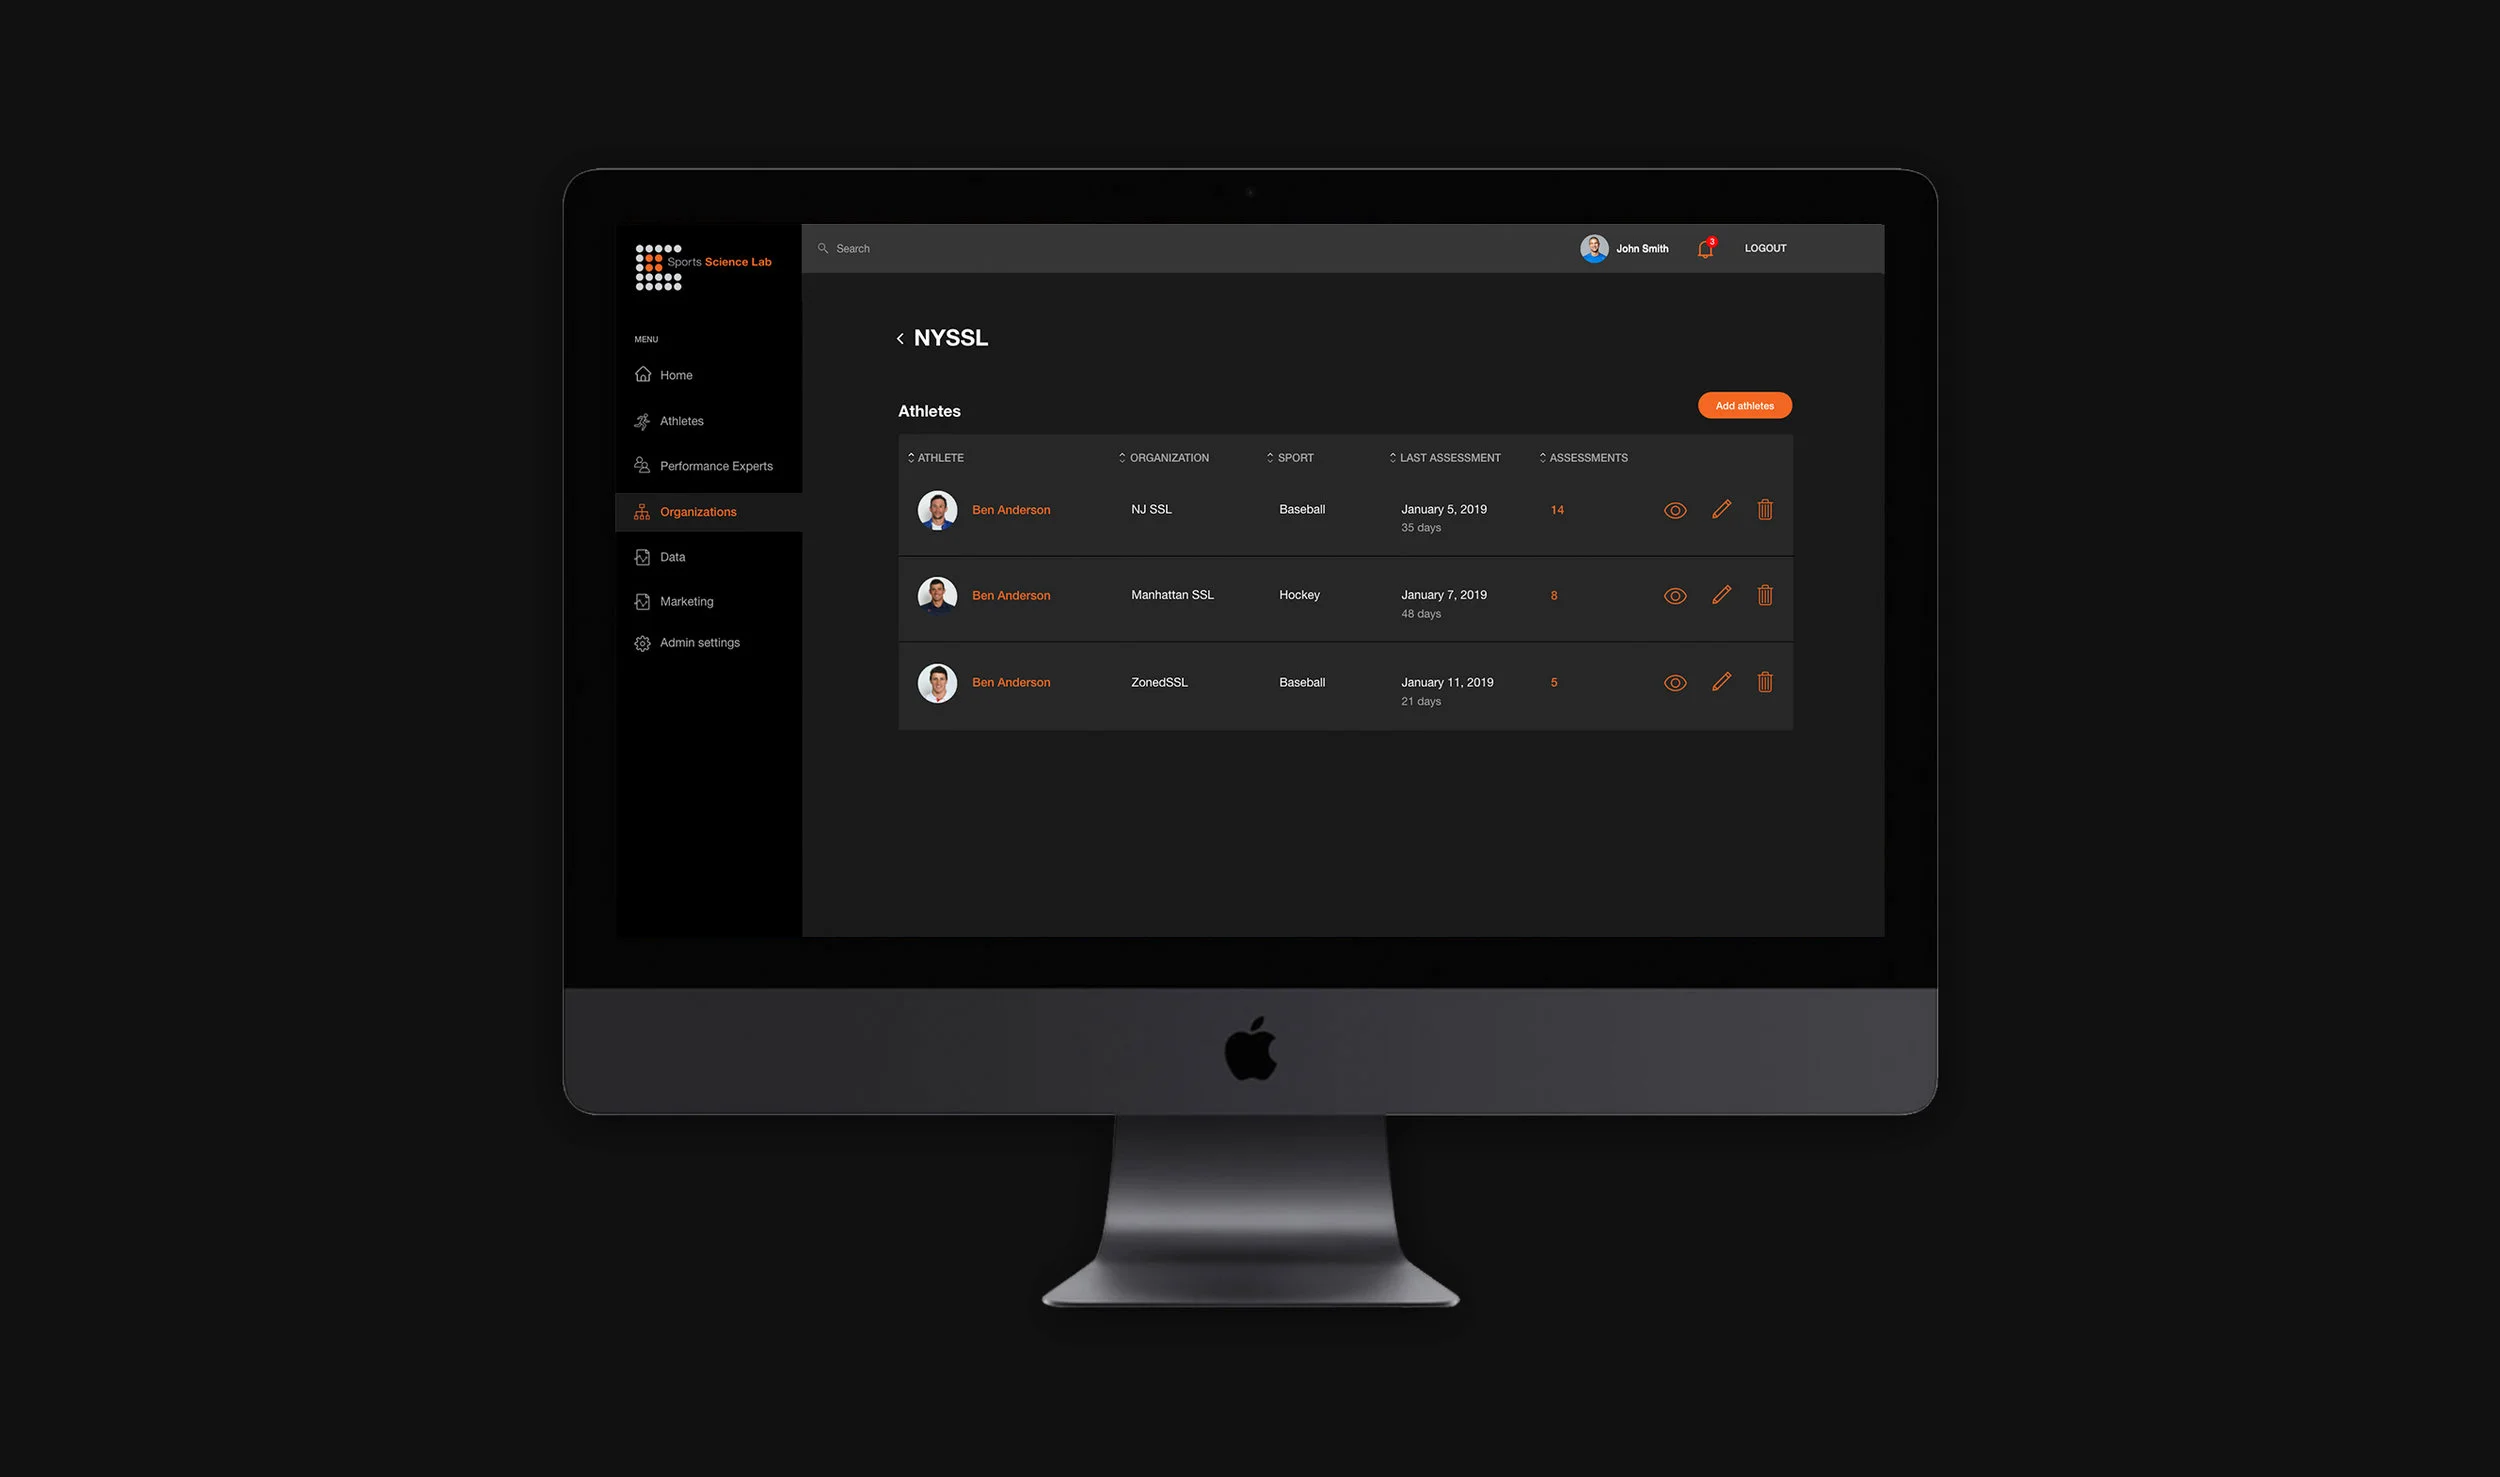
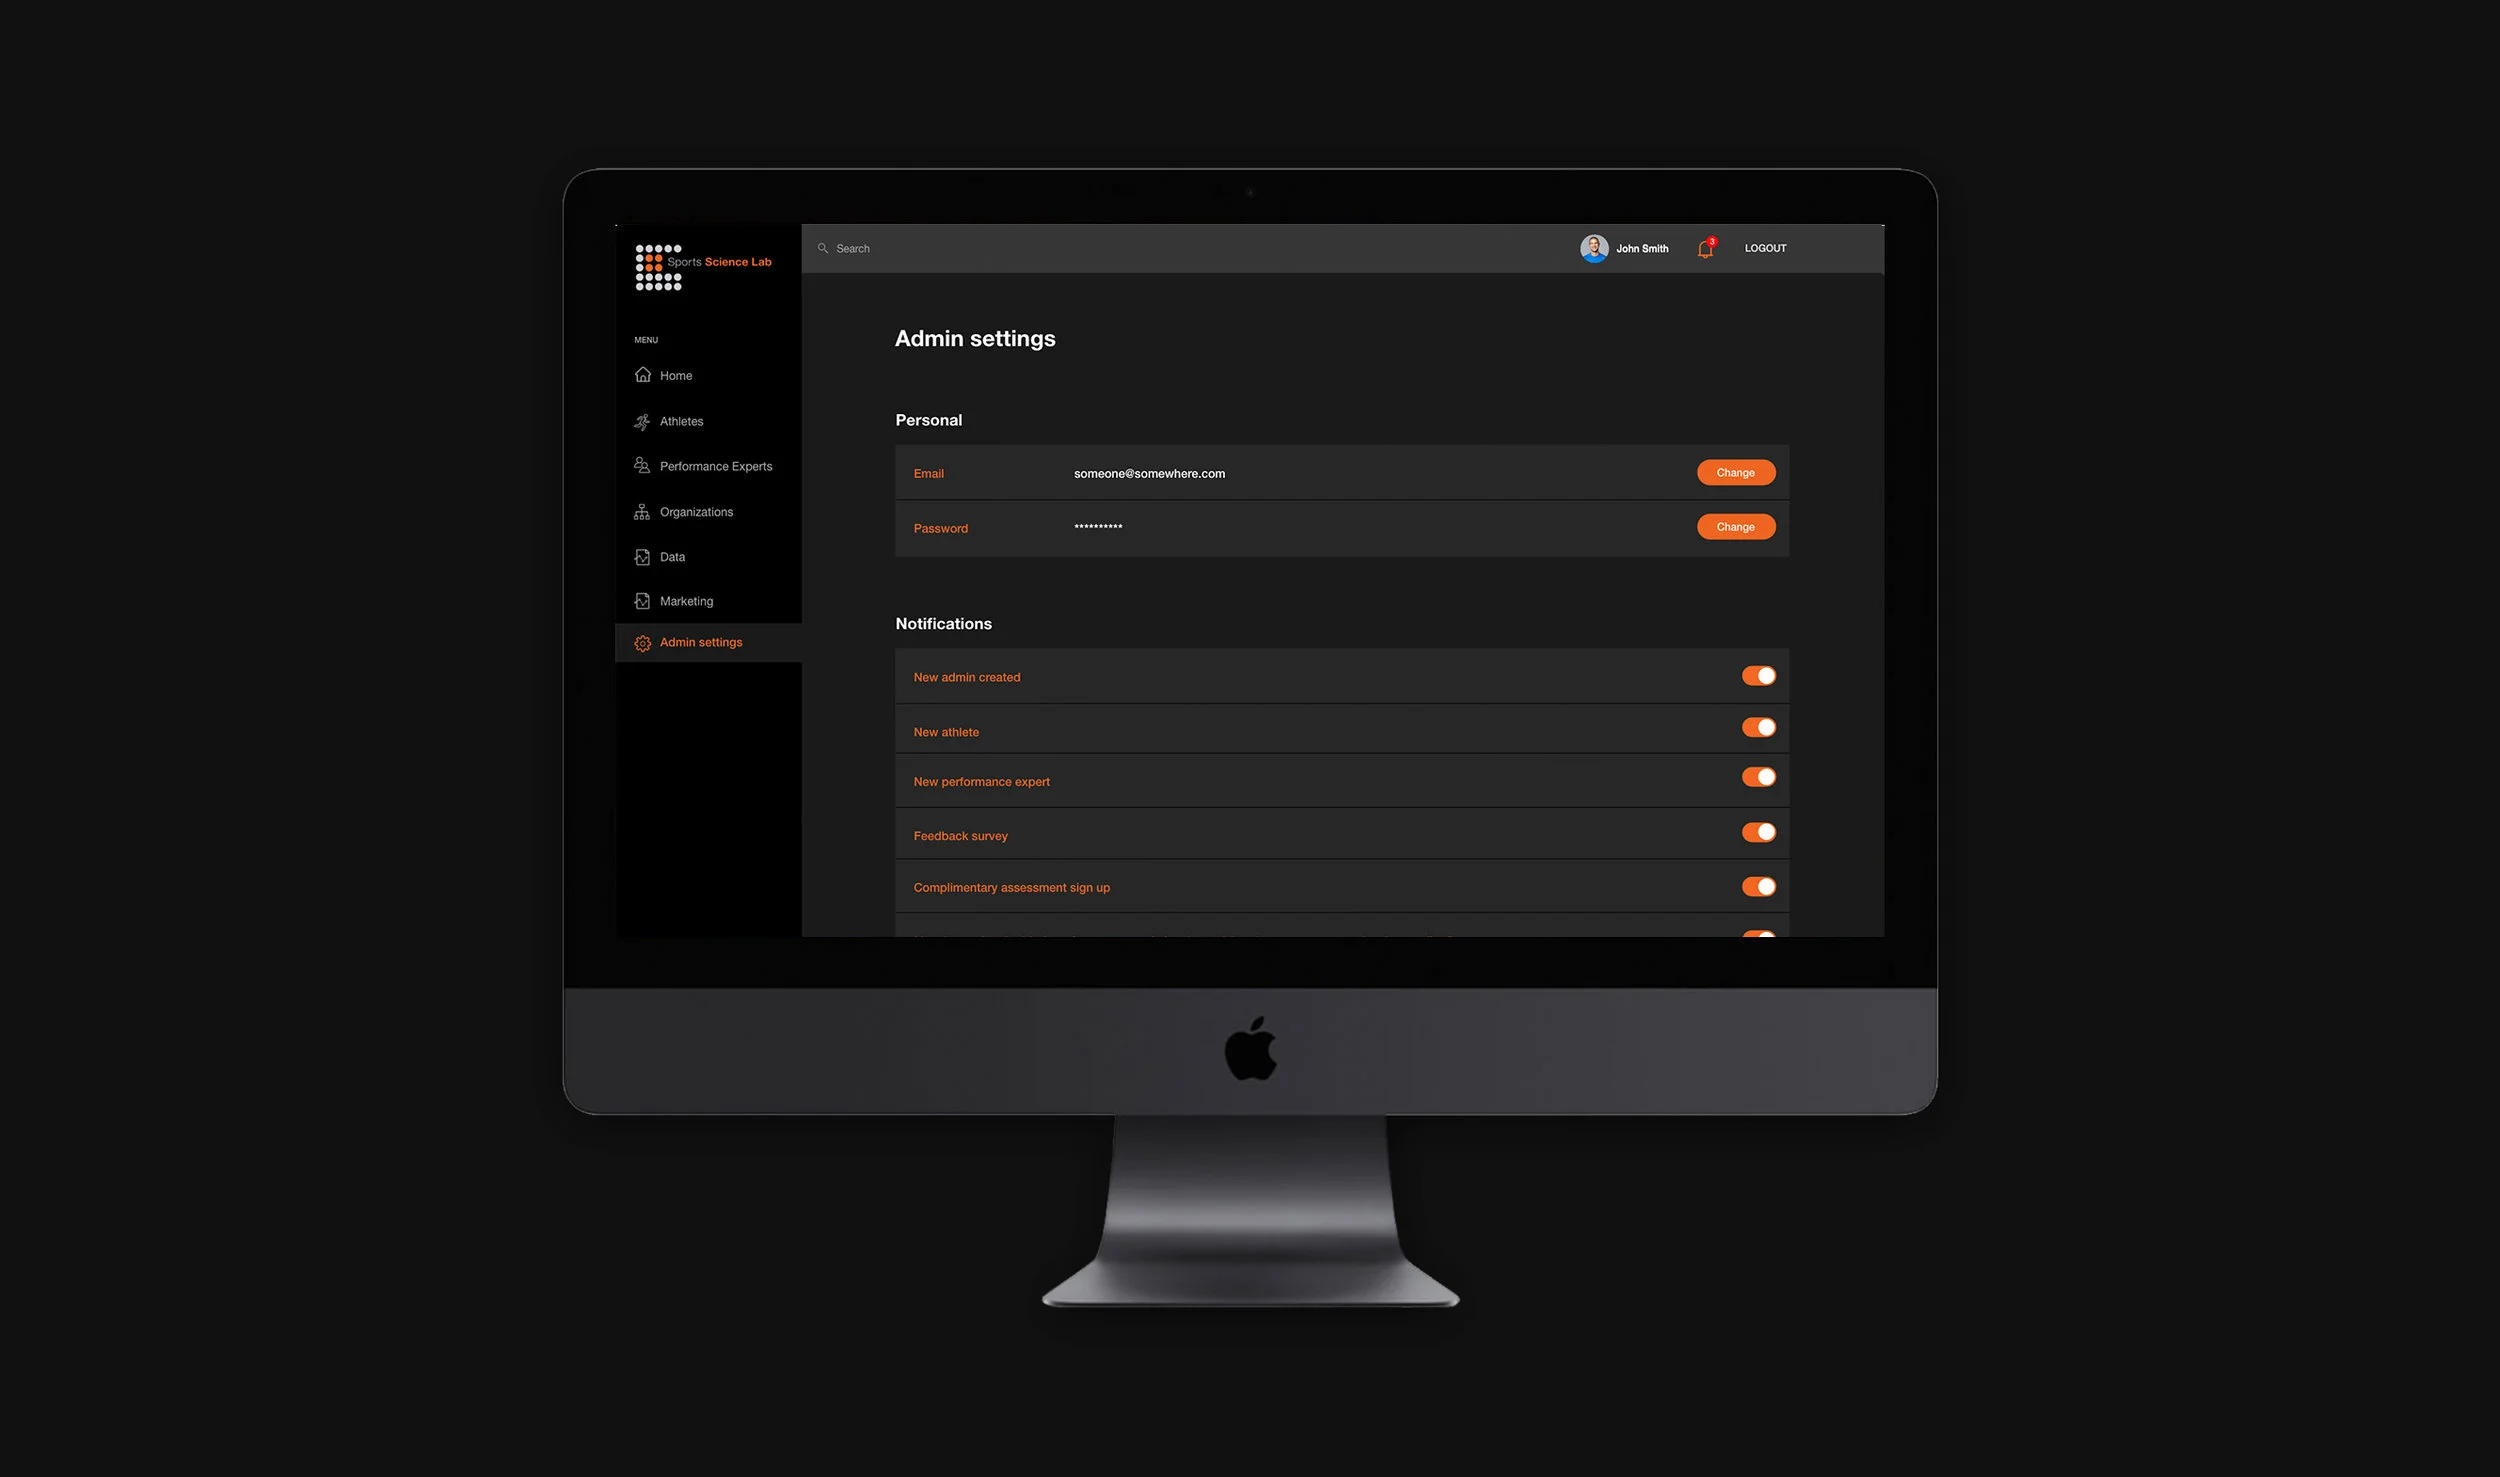
Admins can add athletes and Performance Experts, while also monitoring the data, organizations, and marketing.
Internal App
The main and top priority was to allow NYSSL Performance Experts to upload athlete’s assessment and training data to the database. Other app capabilities include displaying assessment progress, editing data, creating notifications alerts for athlete assessment or if daily data is incomplete.
One of the key challenges for me was to find a clever way to display a wide variety of data. Data visualizations ranged from charts to graphs, both housing very complex data points. I began by researching all data and educating myself on the NYSSL language. I wanted the data to be interactive so the Performance Expert can easily compare thee athlete’s assessments and performance metrics.
Consultation
When an athlete begins the process of becoming a NYSSL athlete, they go through a consultation exercise. This takes them through a run down of their current abilities and is a section to instate the goals they want to hit and the mantra they uphold while training with NYSSL.
Complimentary assessment
When the athlete joins NYSSL, the complimentary assessment is the first step. The assessment can then be emailed to a recipient.
Athlete Profile
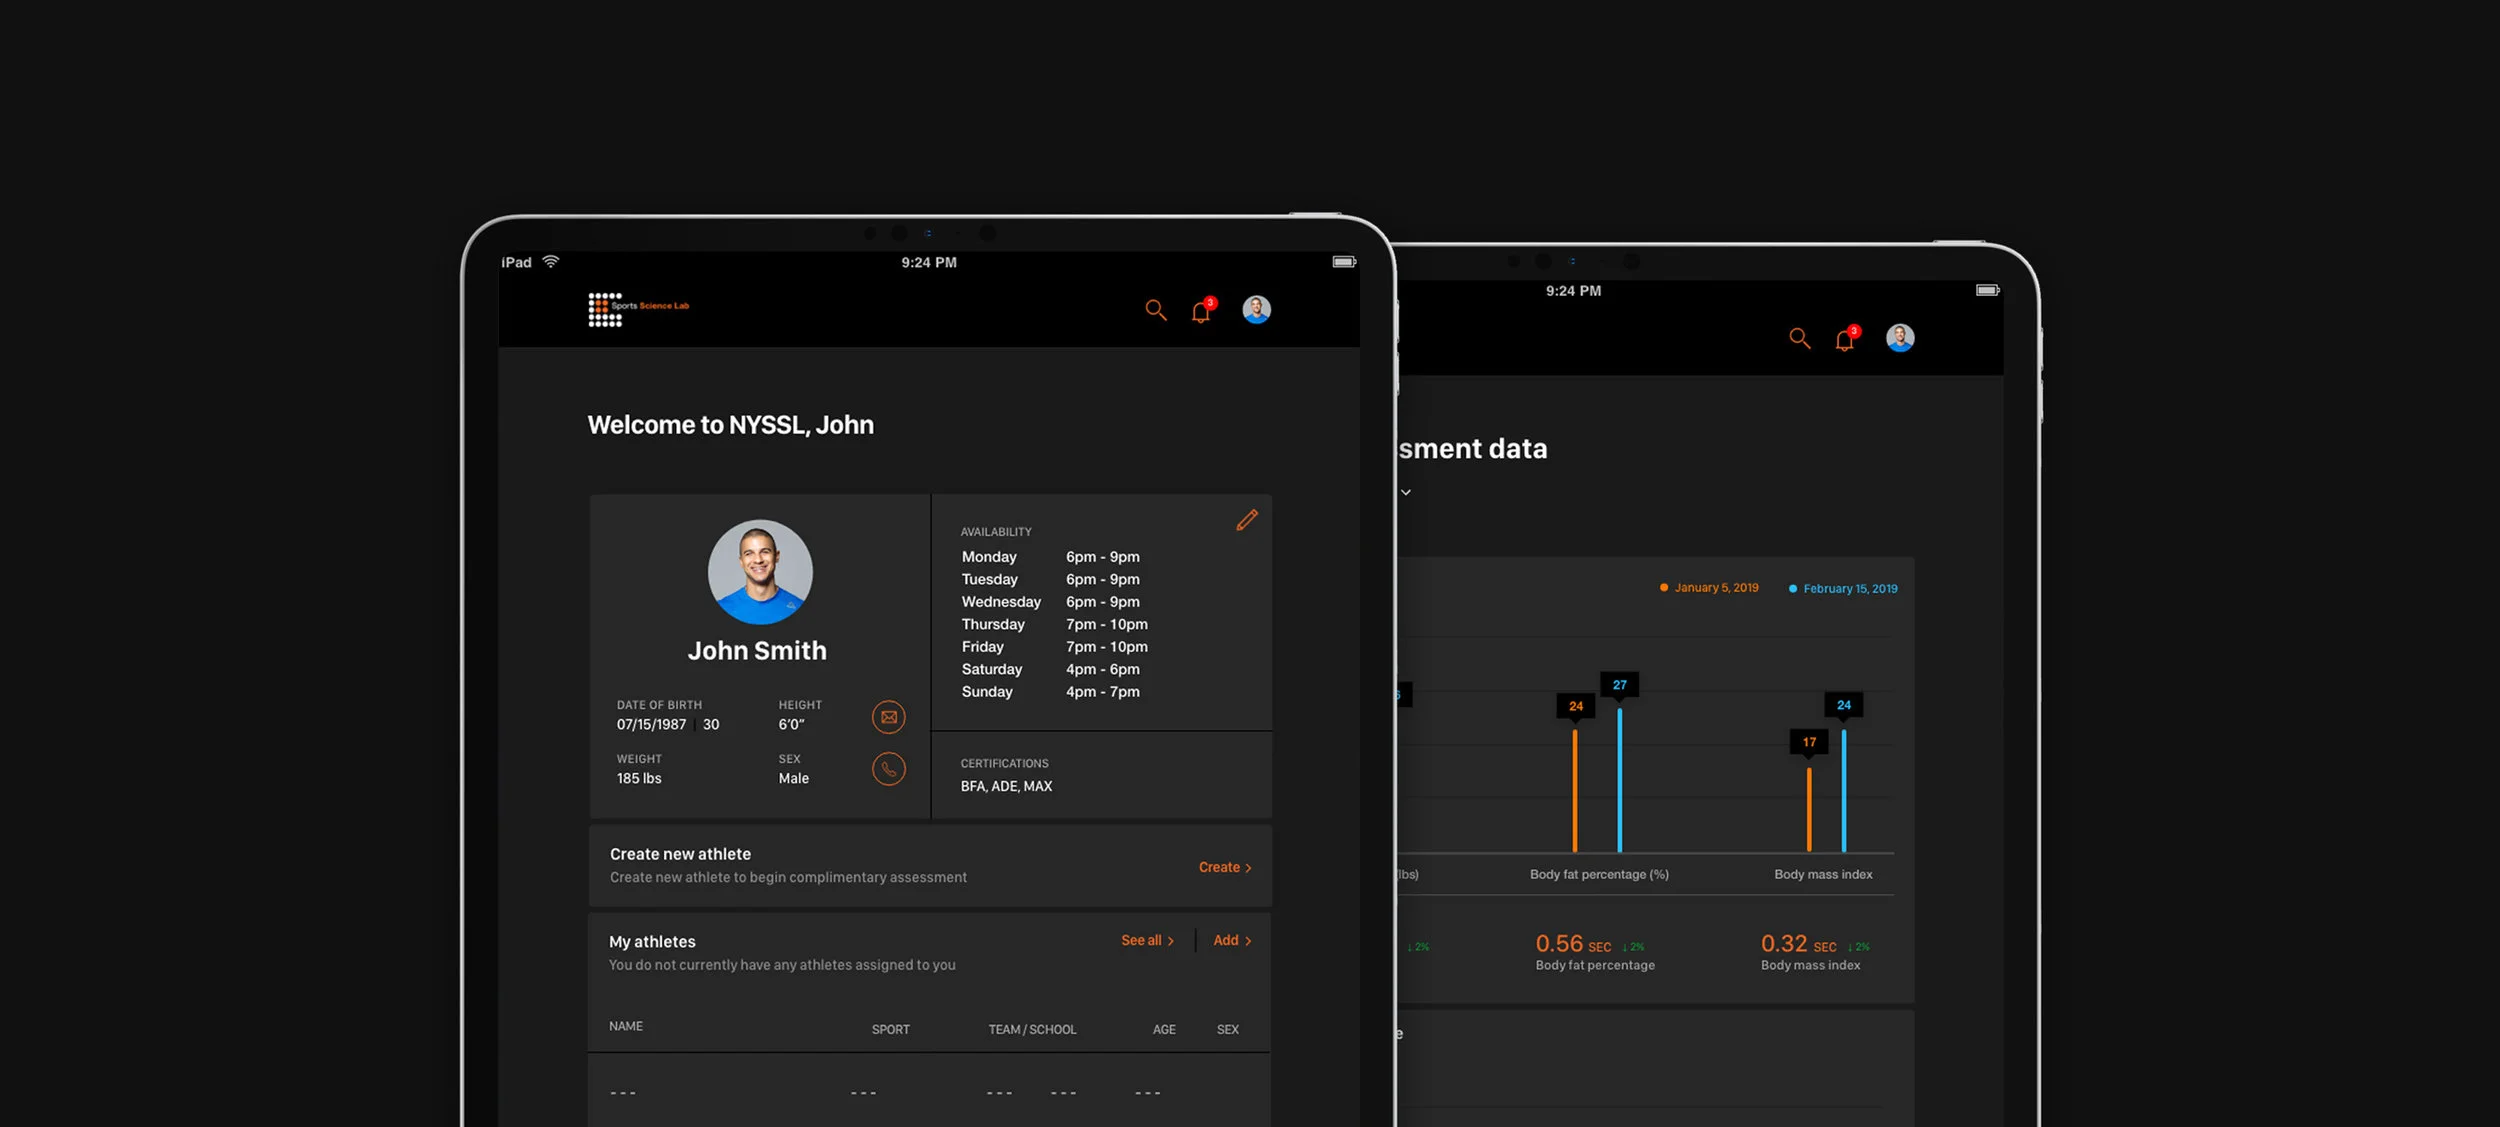
The athlete profile allows the Performance Expert to easily find all relevant information about each athlete and to keep track of all assessment statuses.
Entry Screens
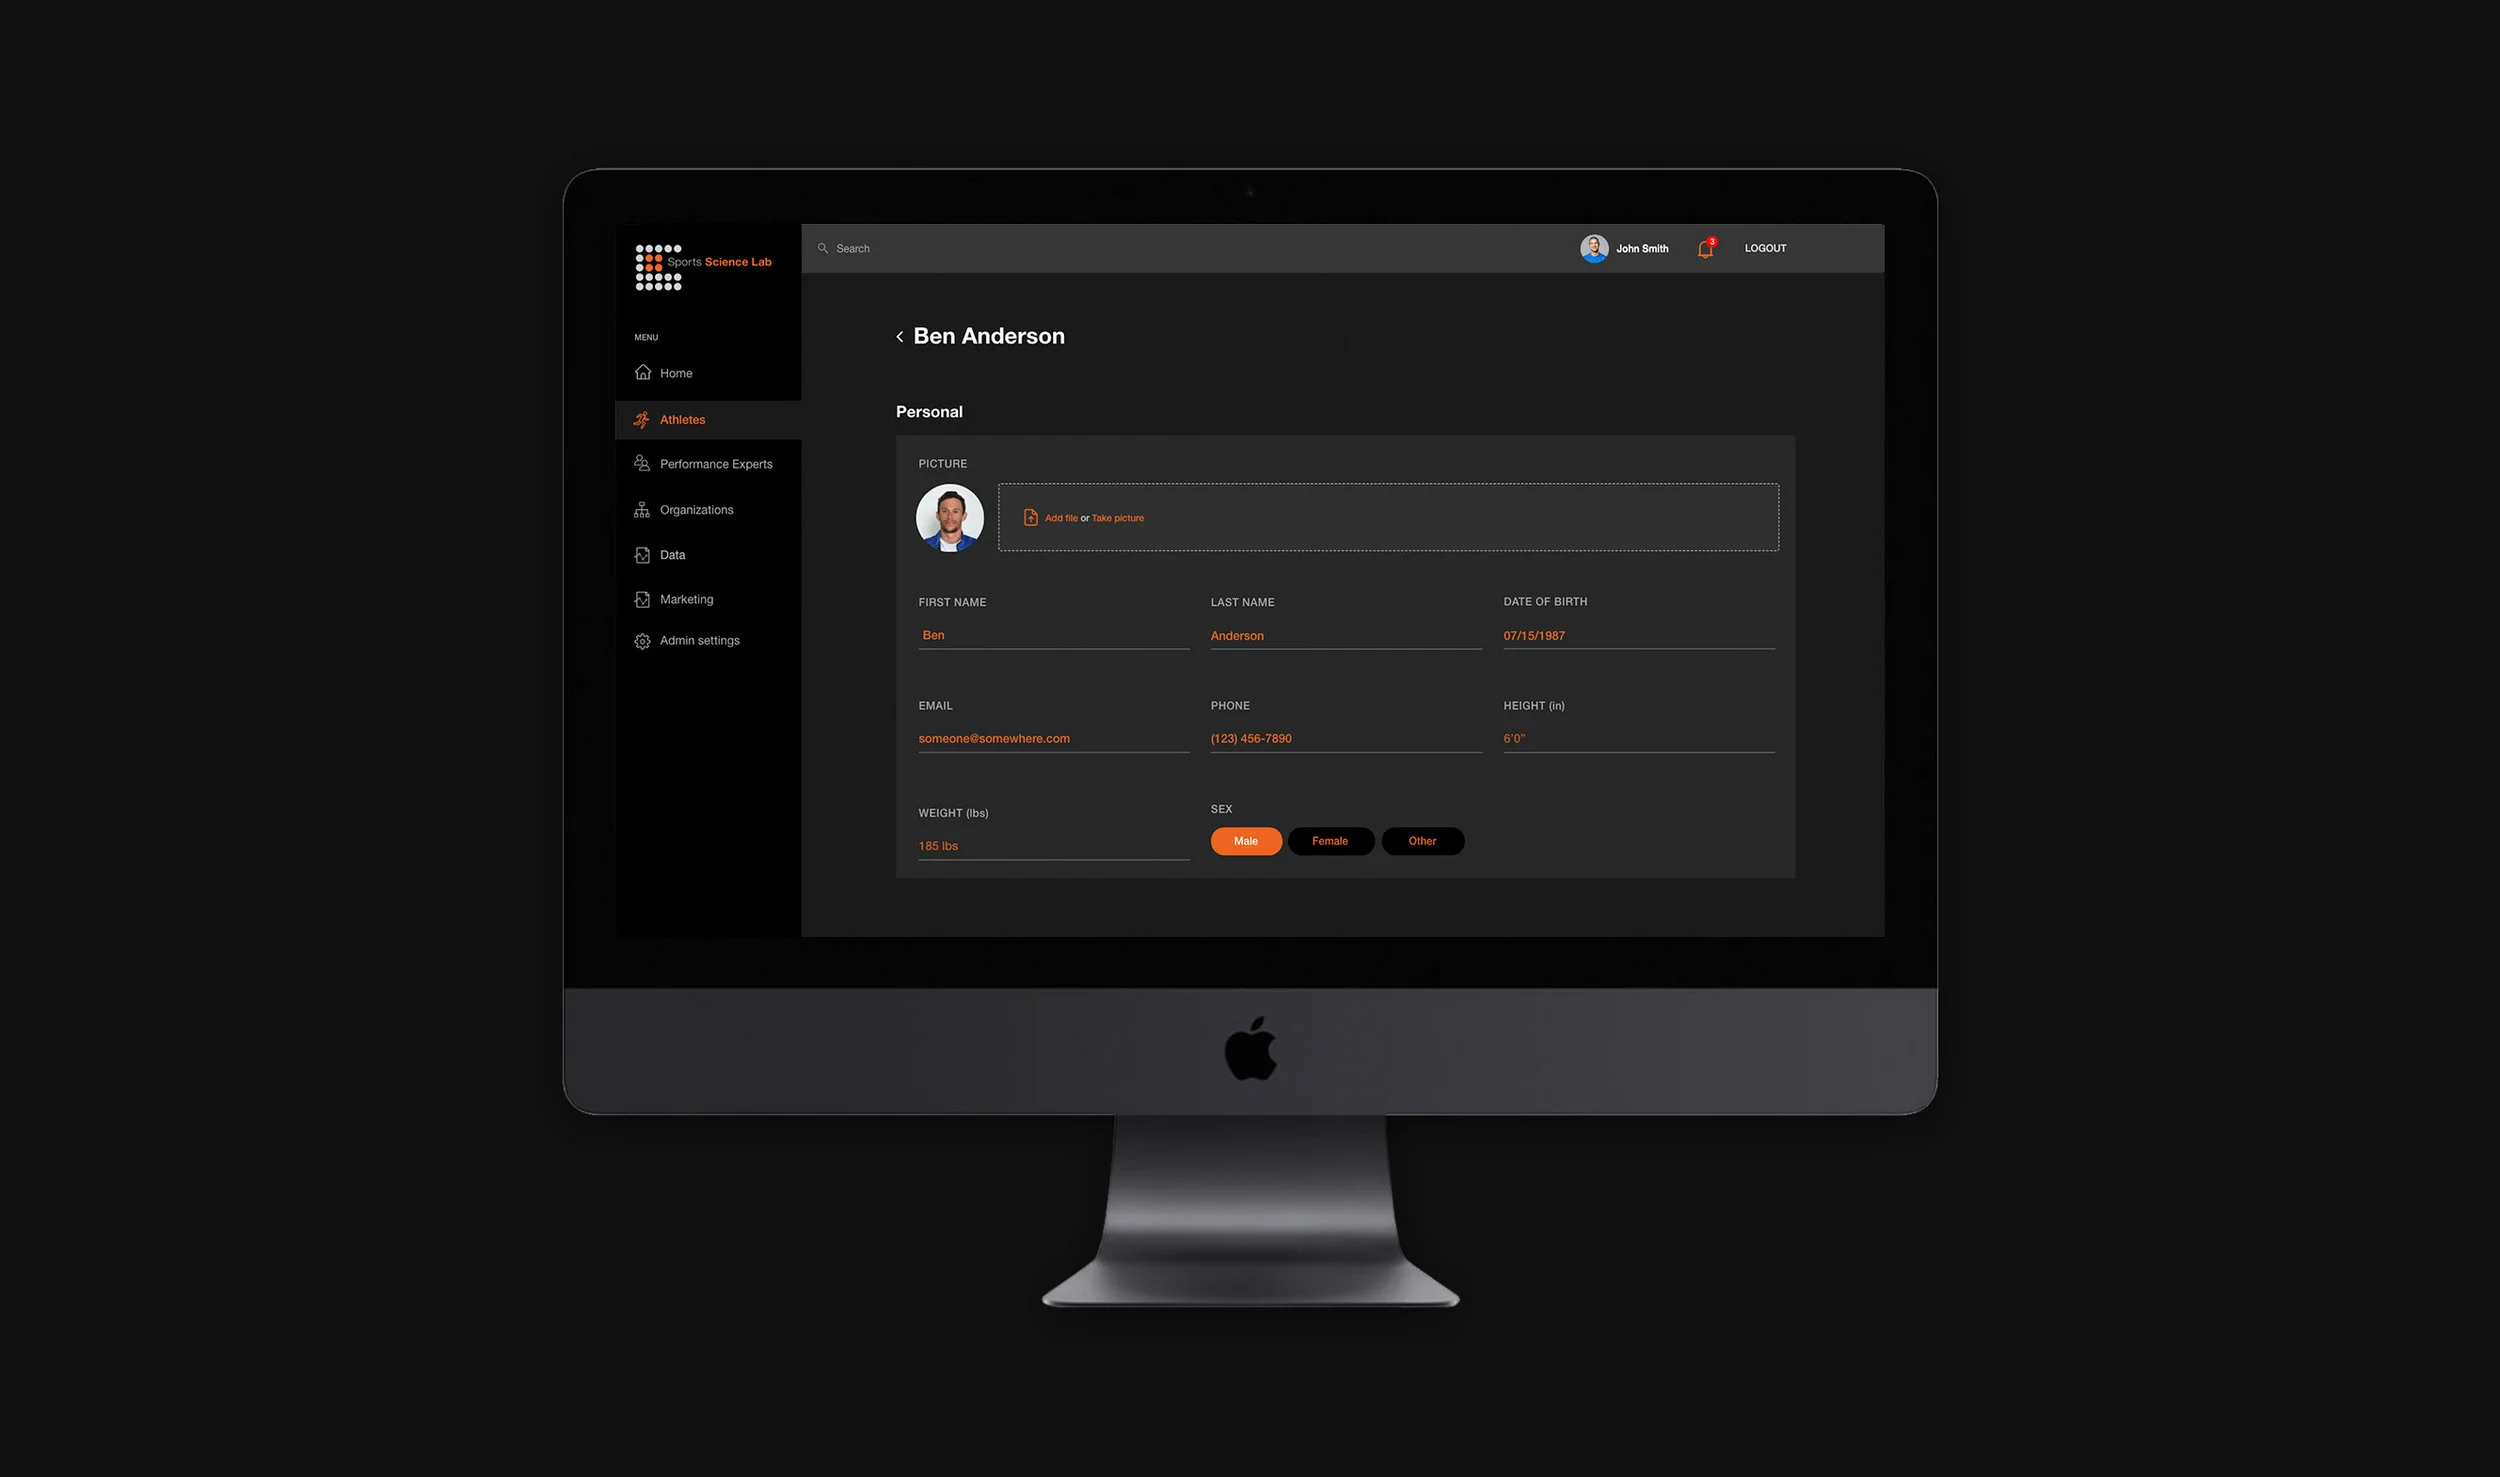
Entry screens were created for each assessment type, as well as for creating an athlete and Performance Expert.
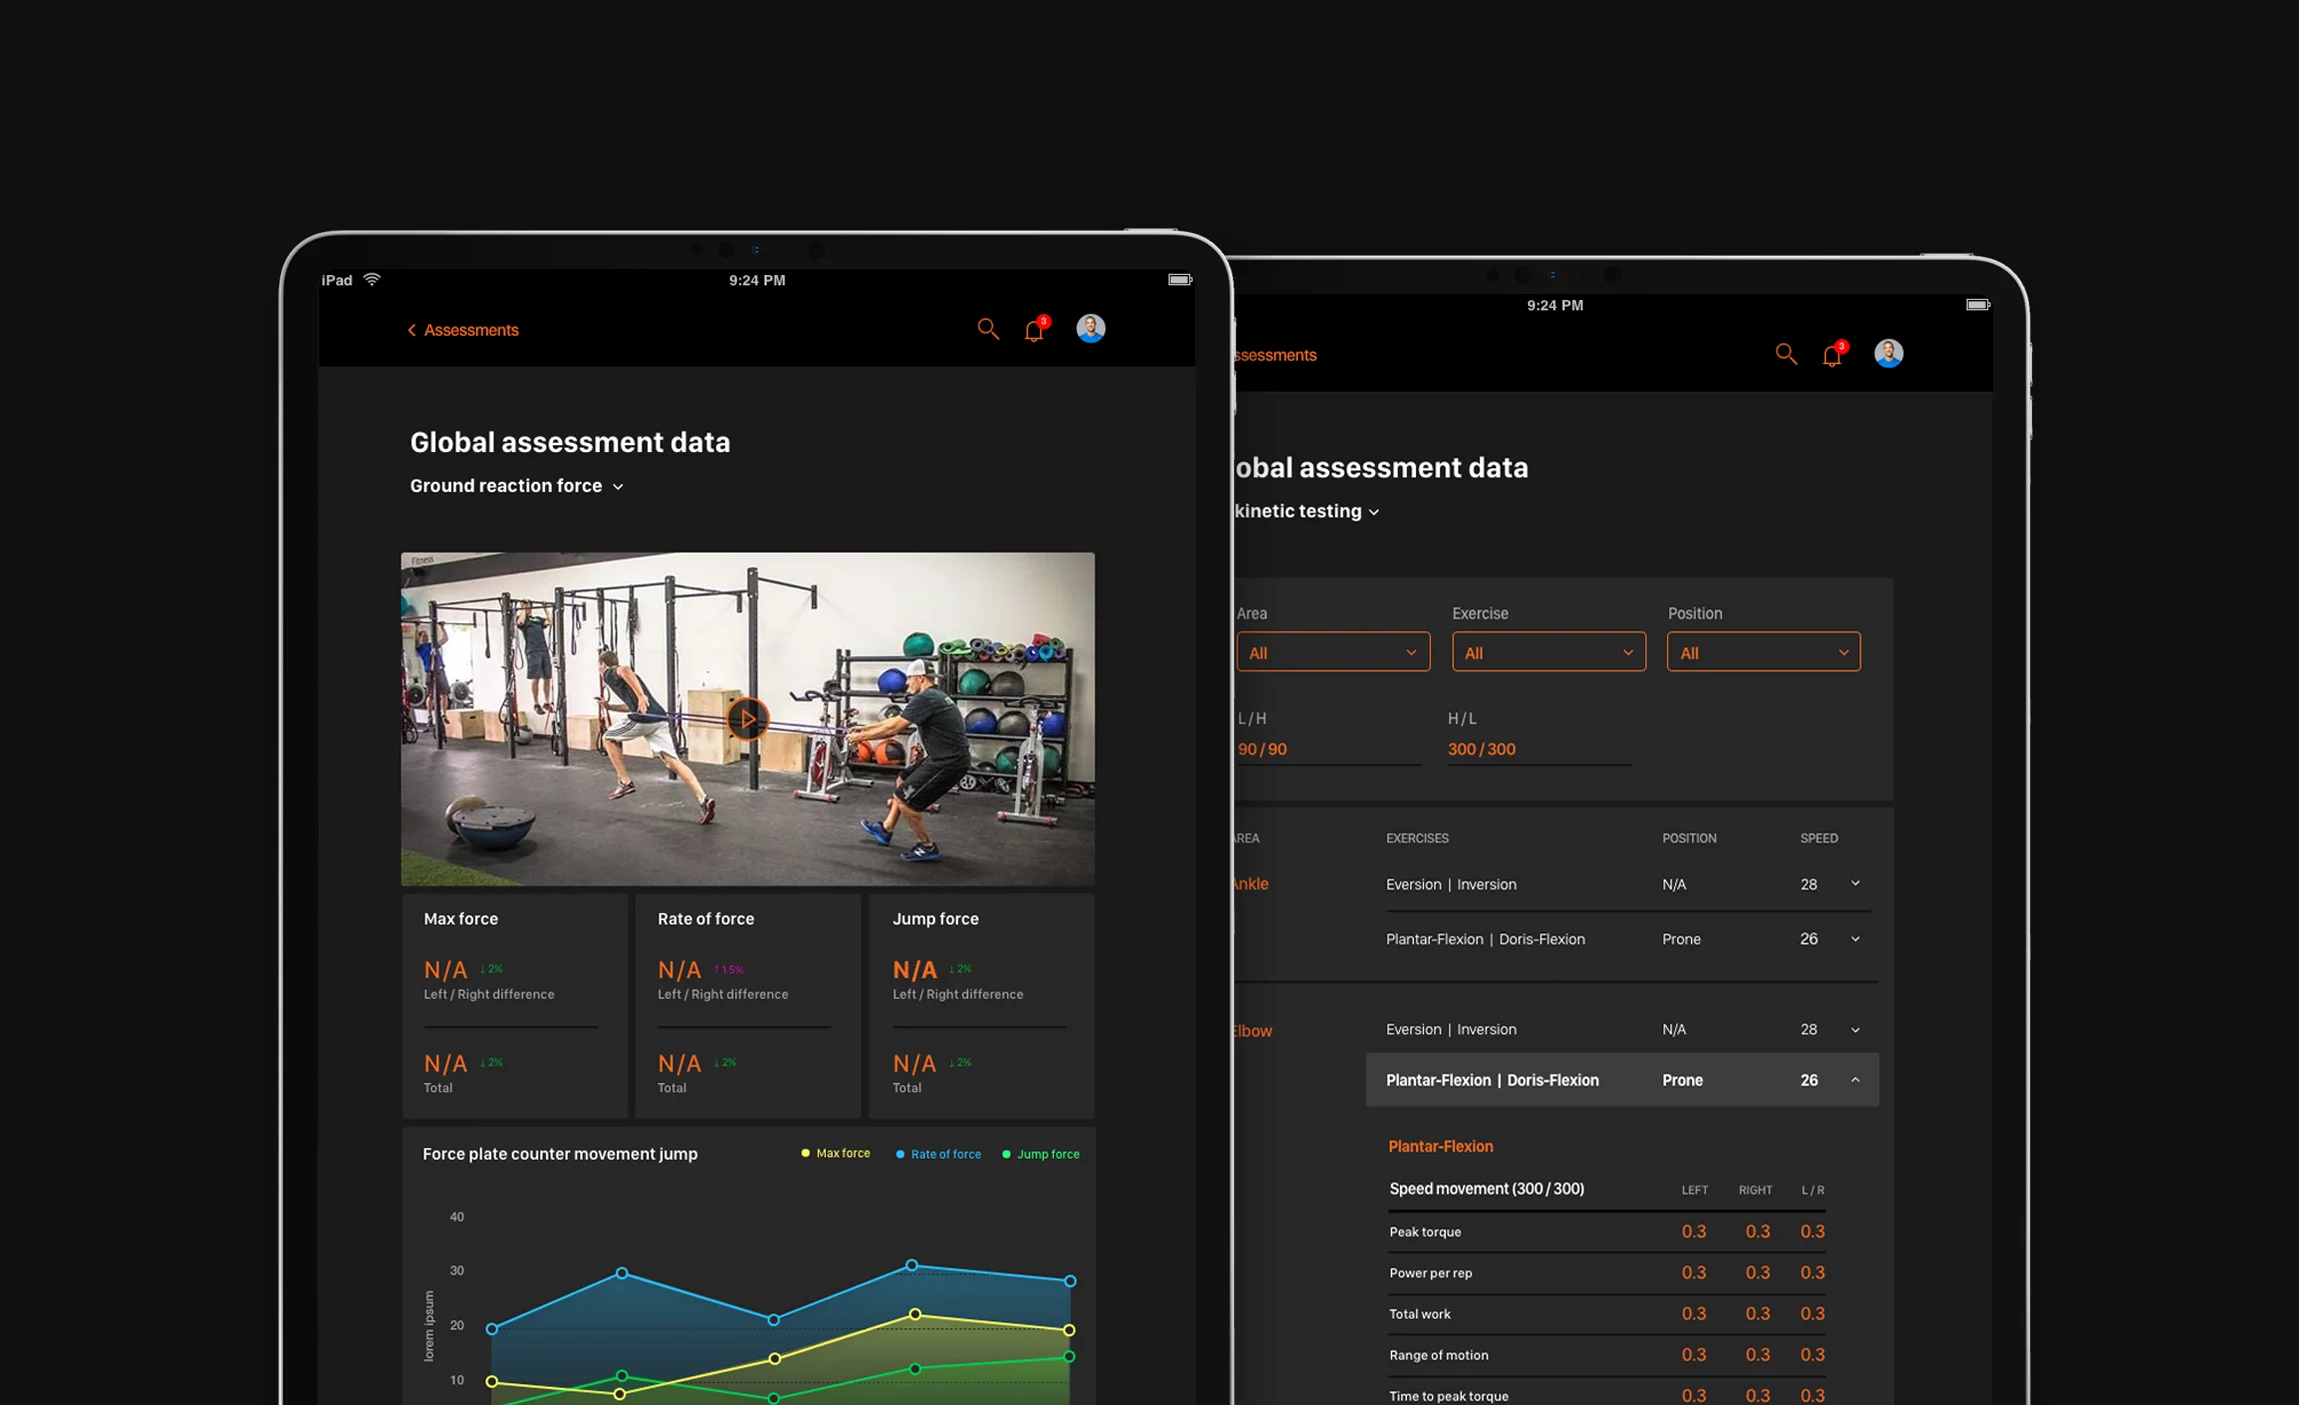
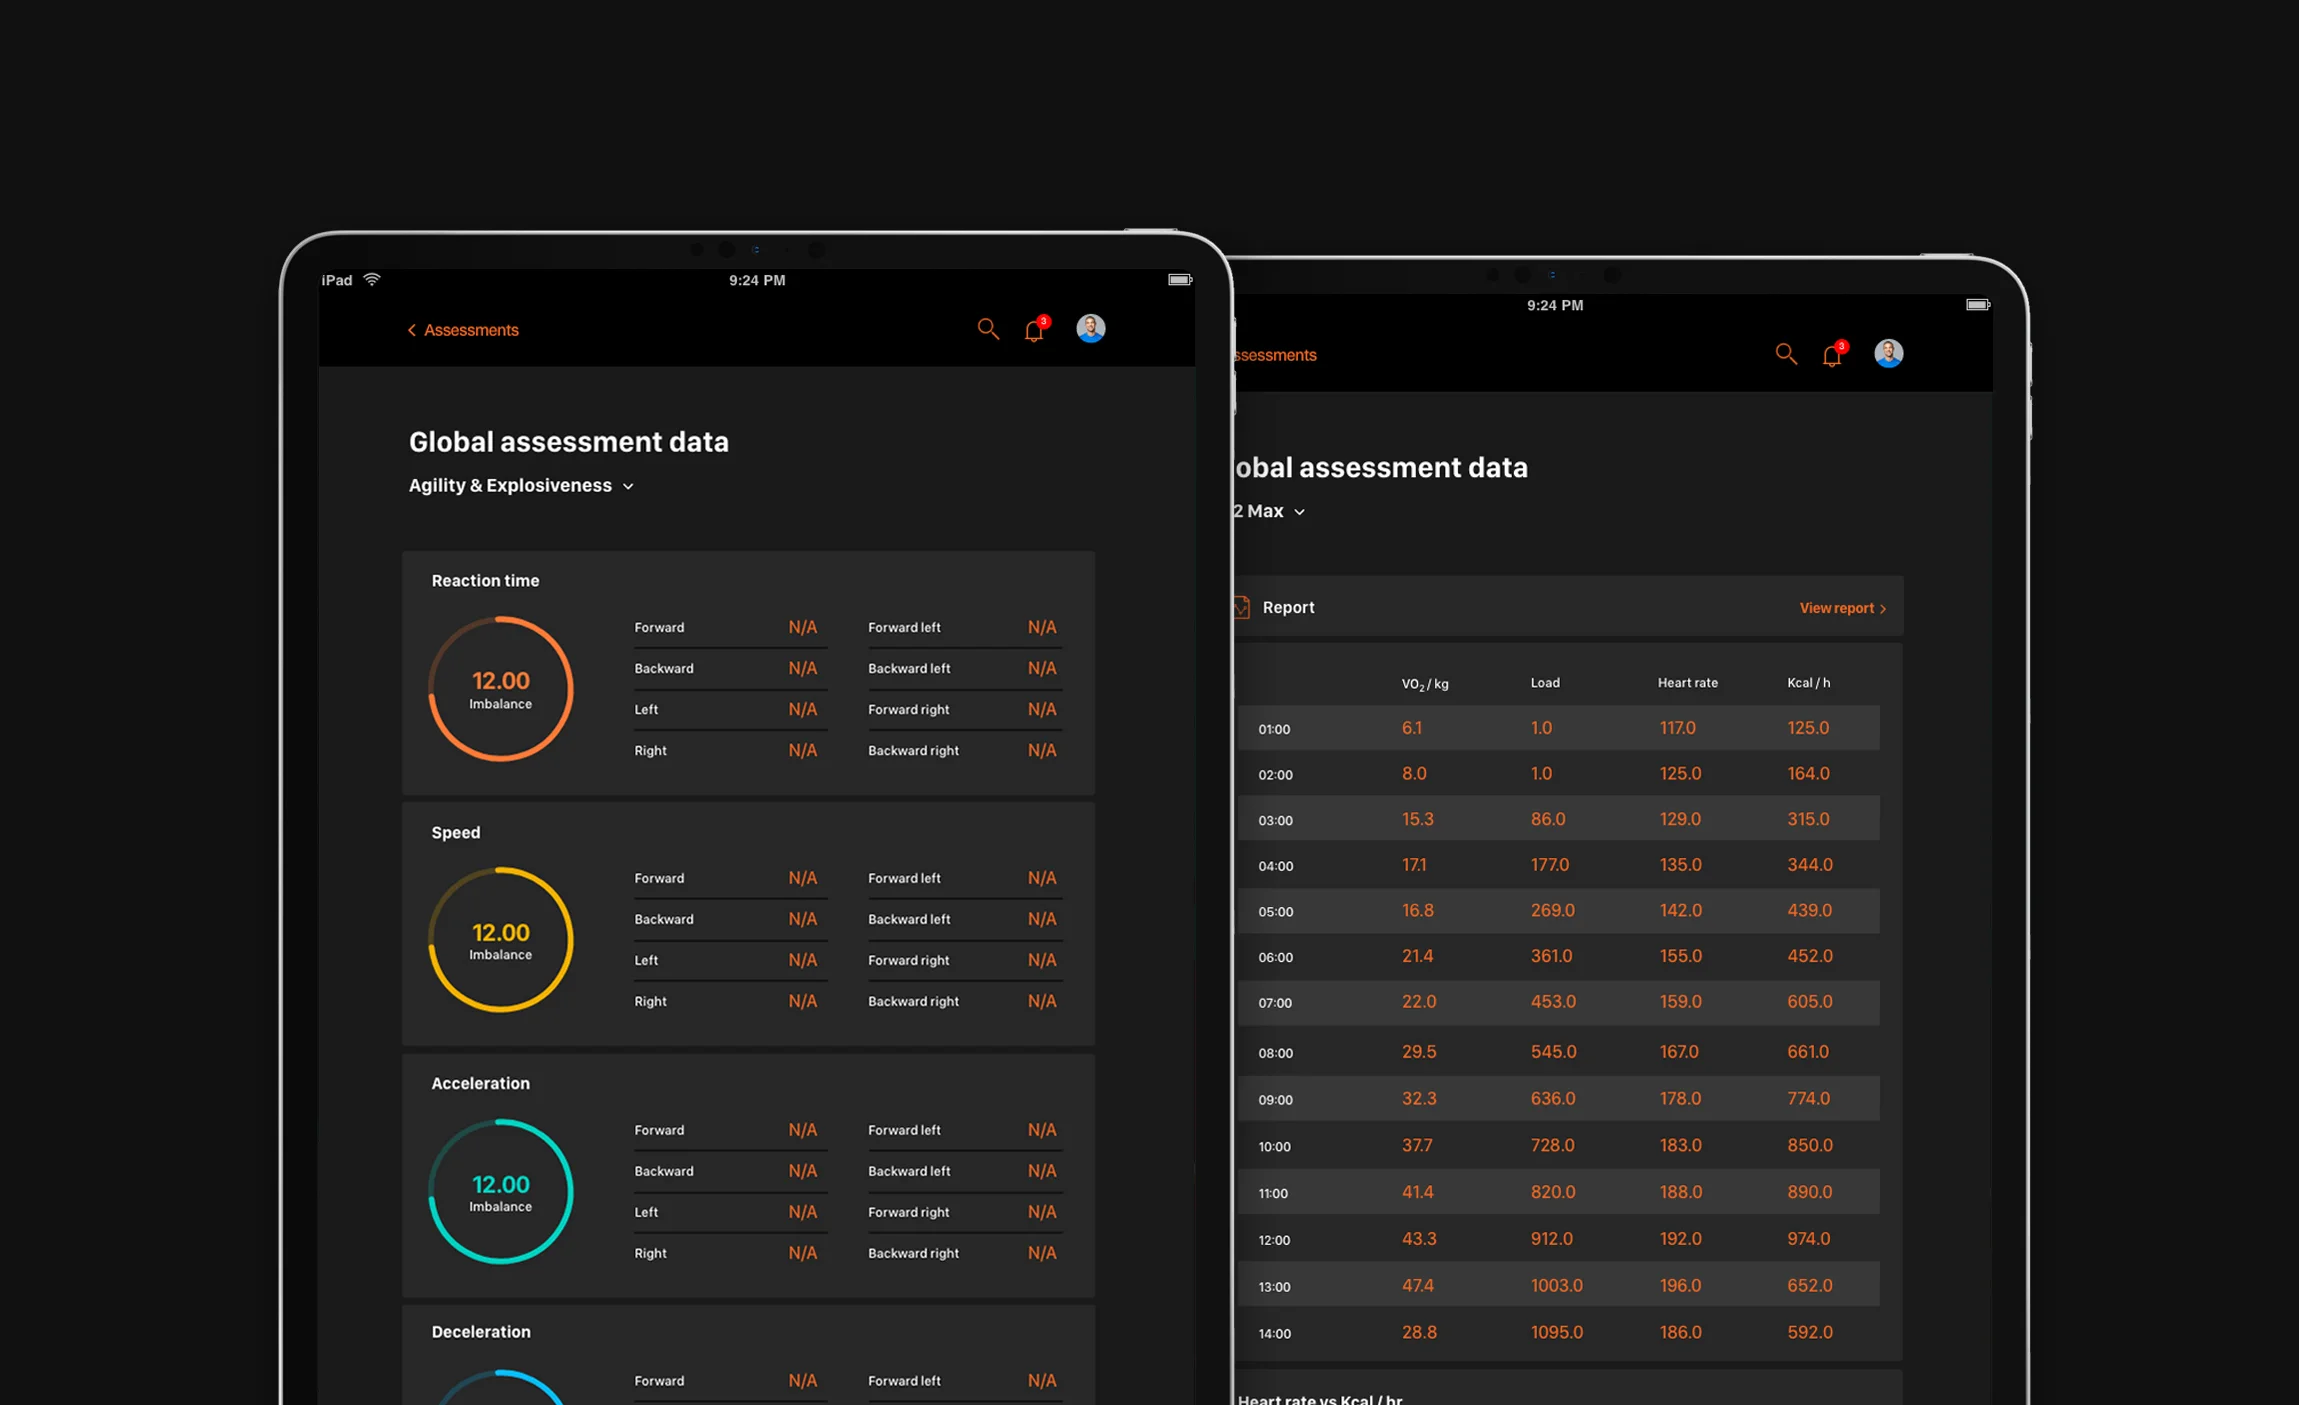
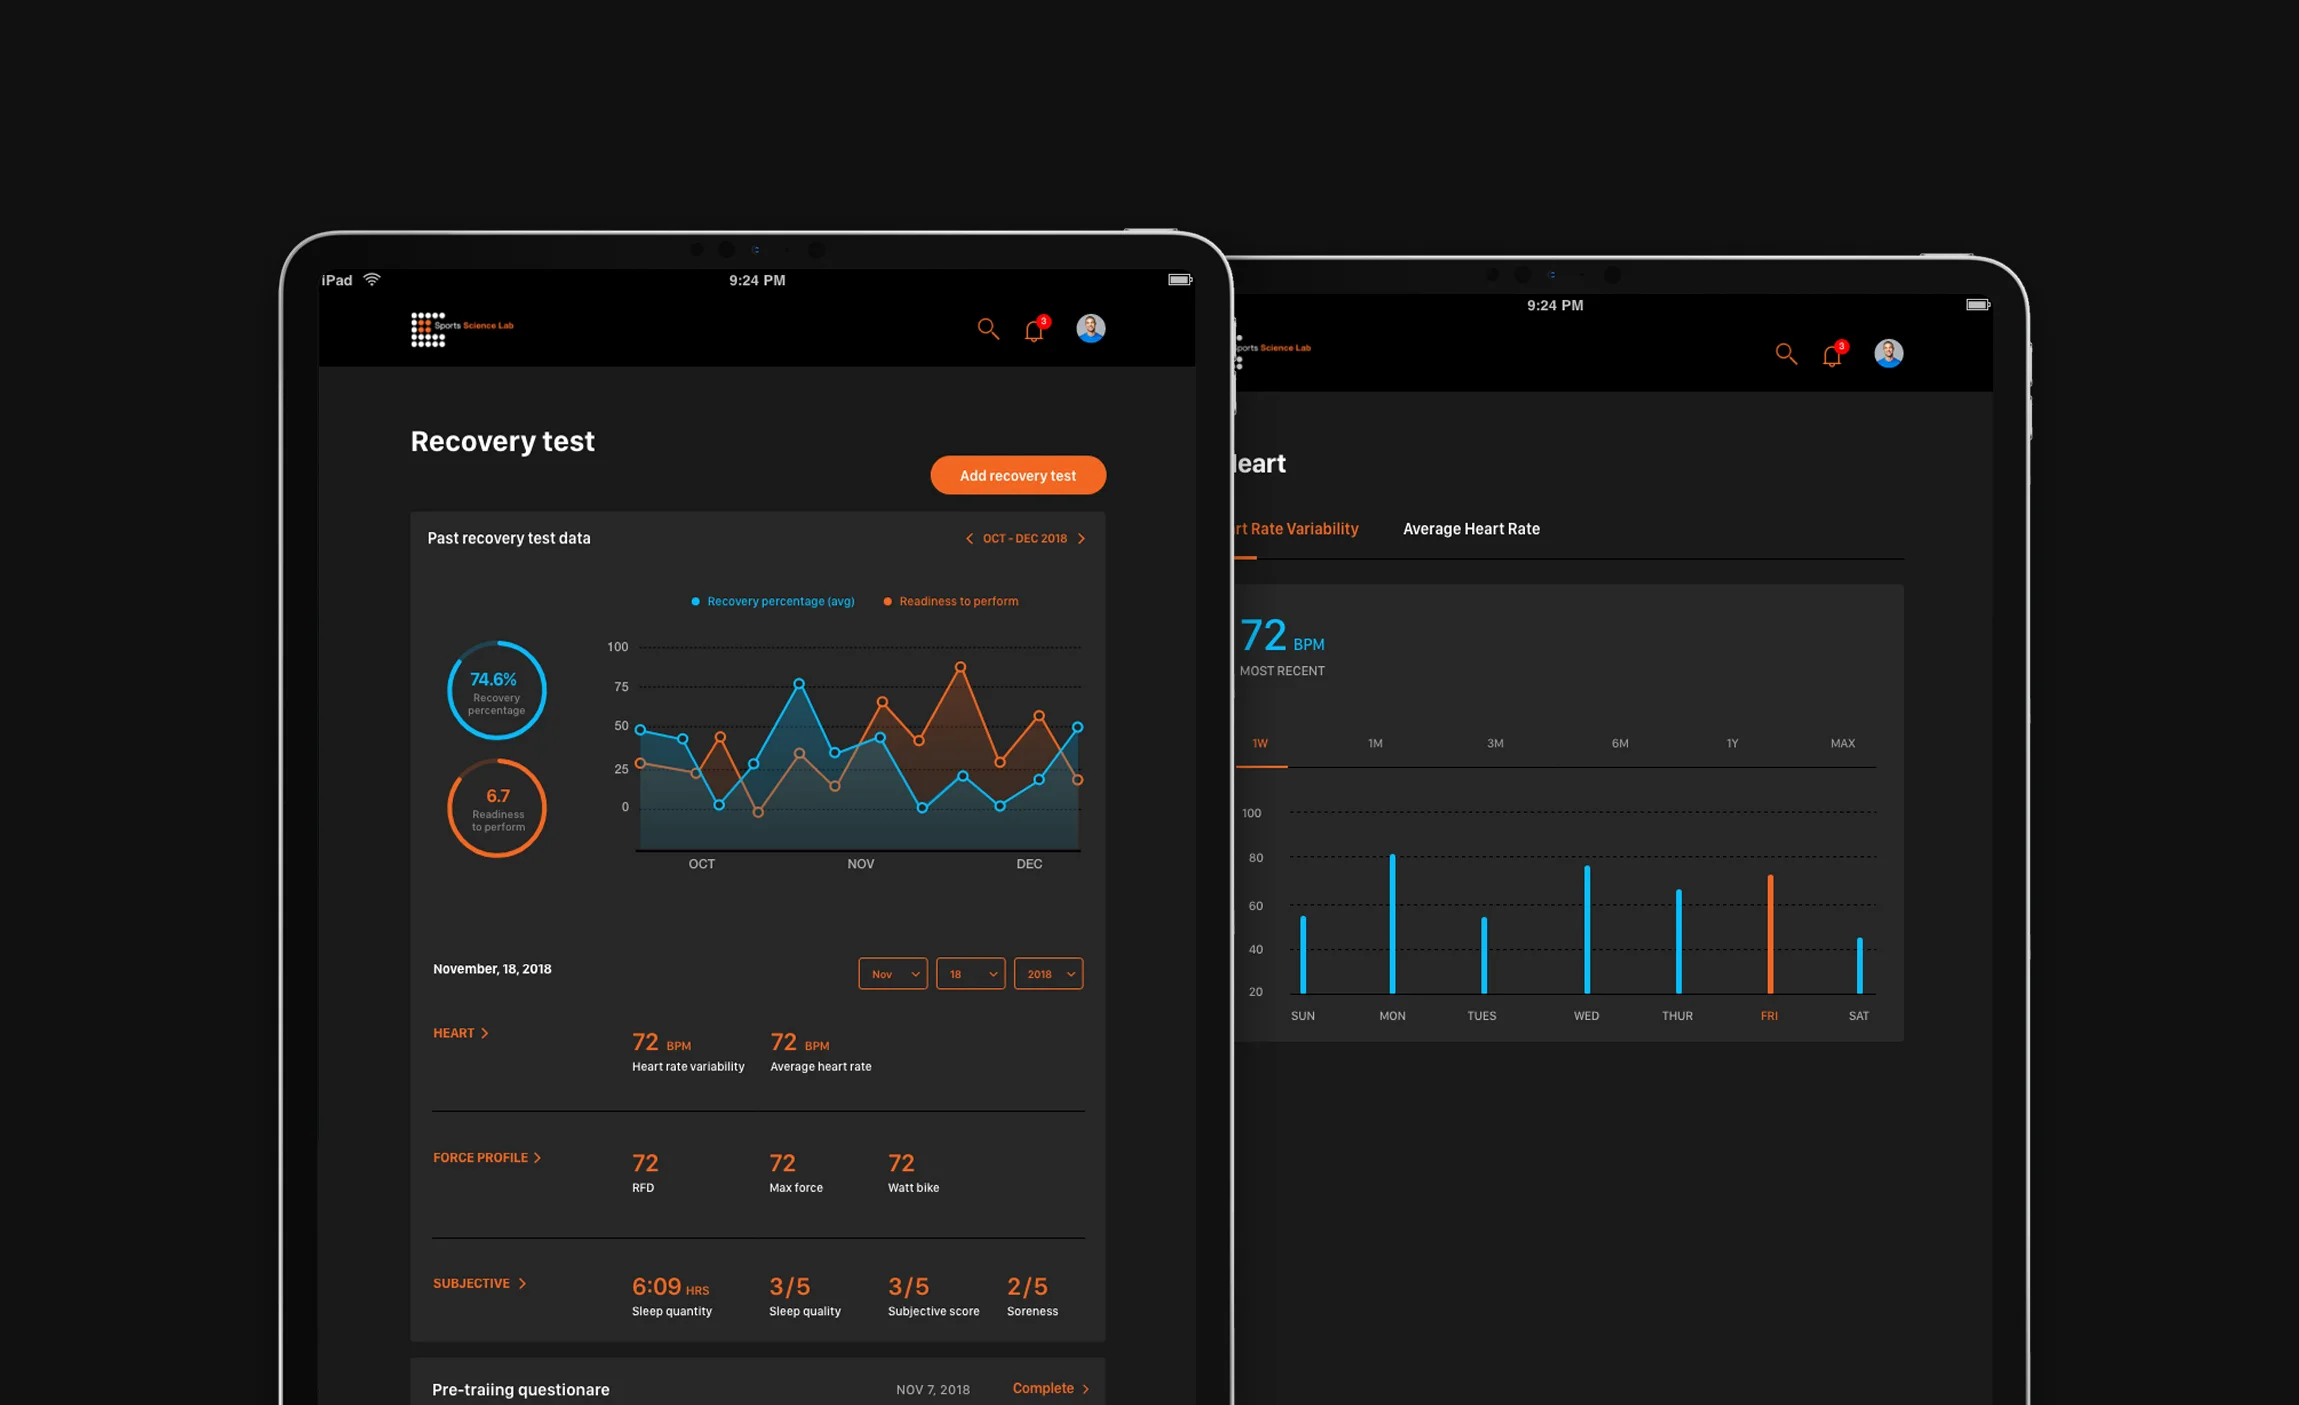
Data Visualizations & Analytics
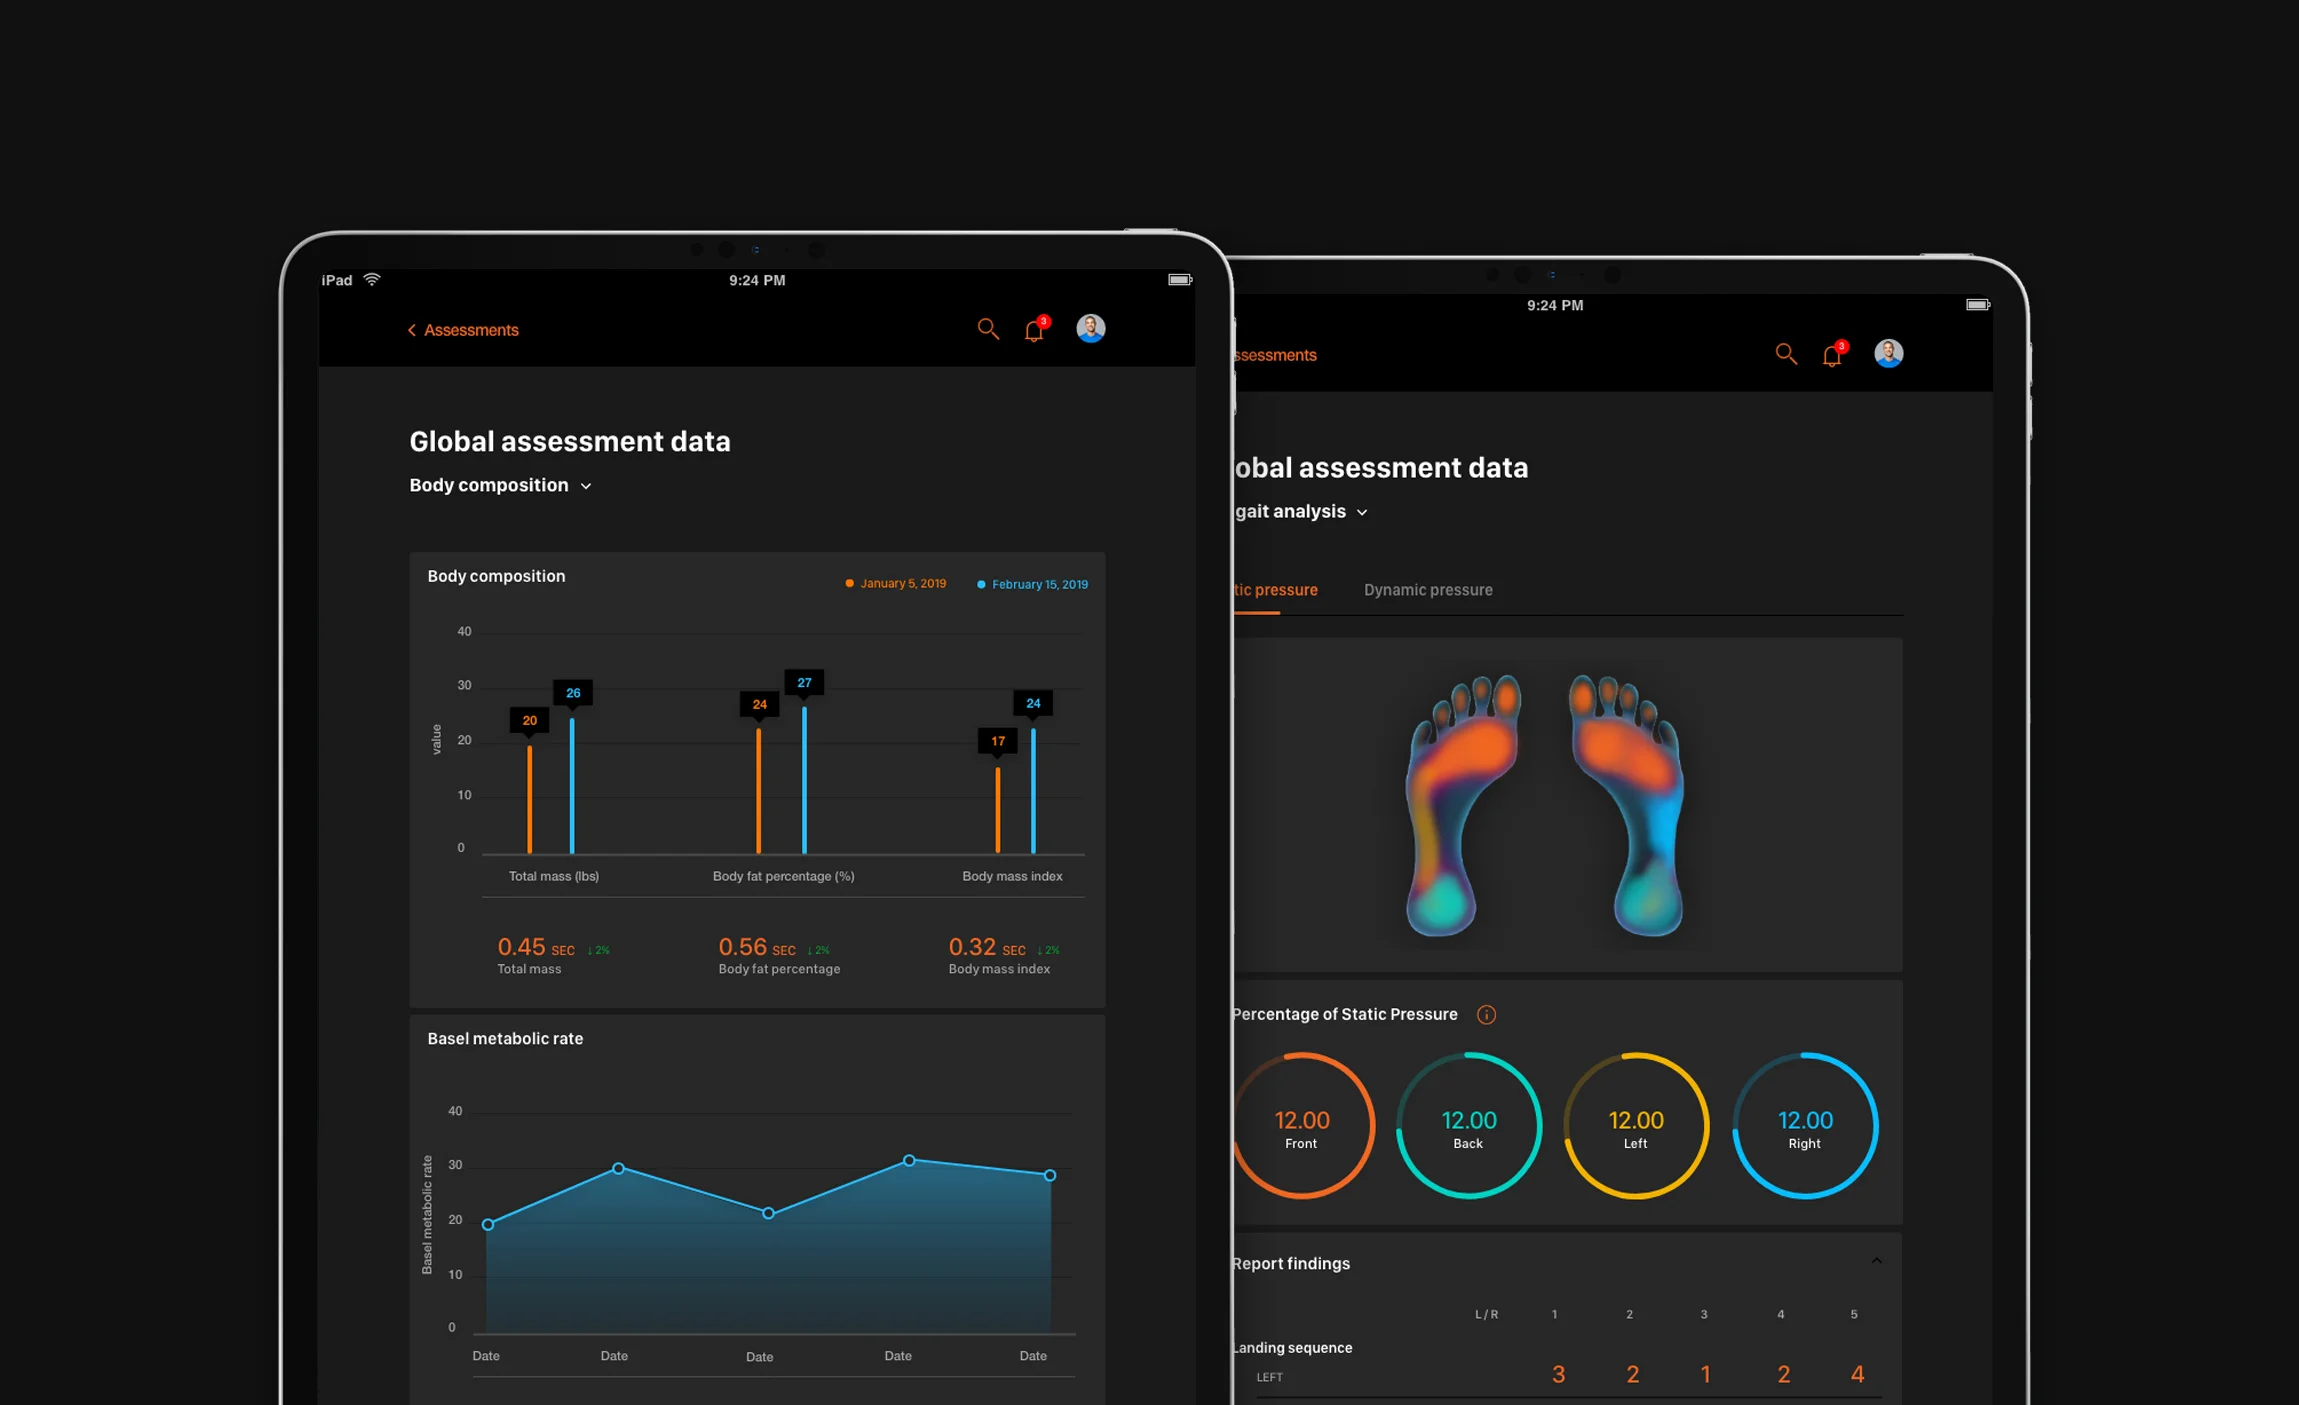
Different data visuals were needed to show all the information clearly for the Performance Expert to analyze. Each format corresponds to the content from the original spreadsheets.
Group Training
Group training allows the Performance Expert to training multiple athletes at once, monitoring their data and comparing them.
Search & Notifications
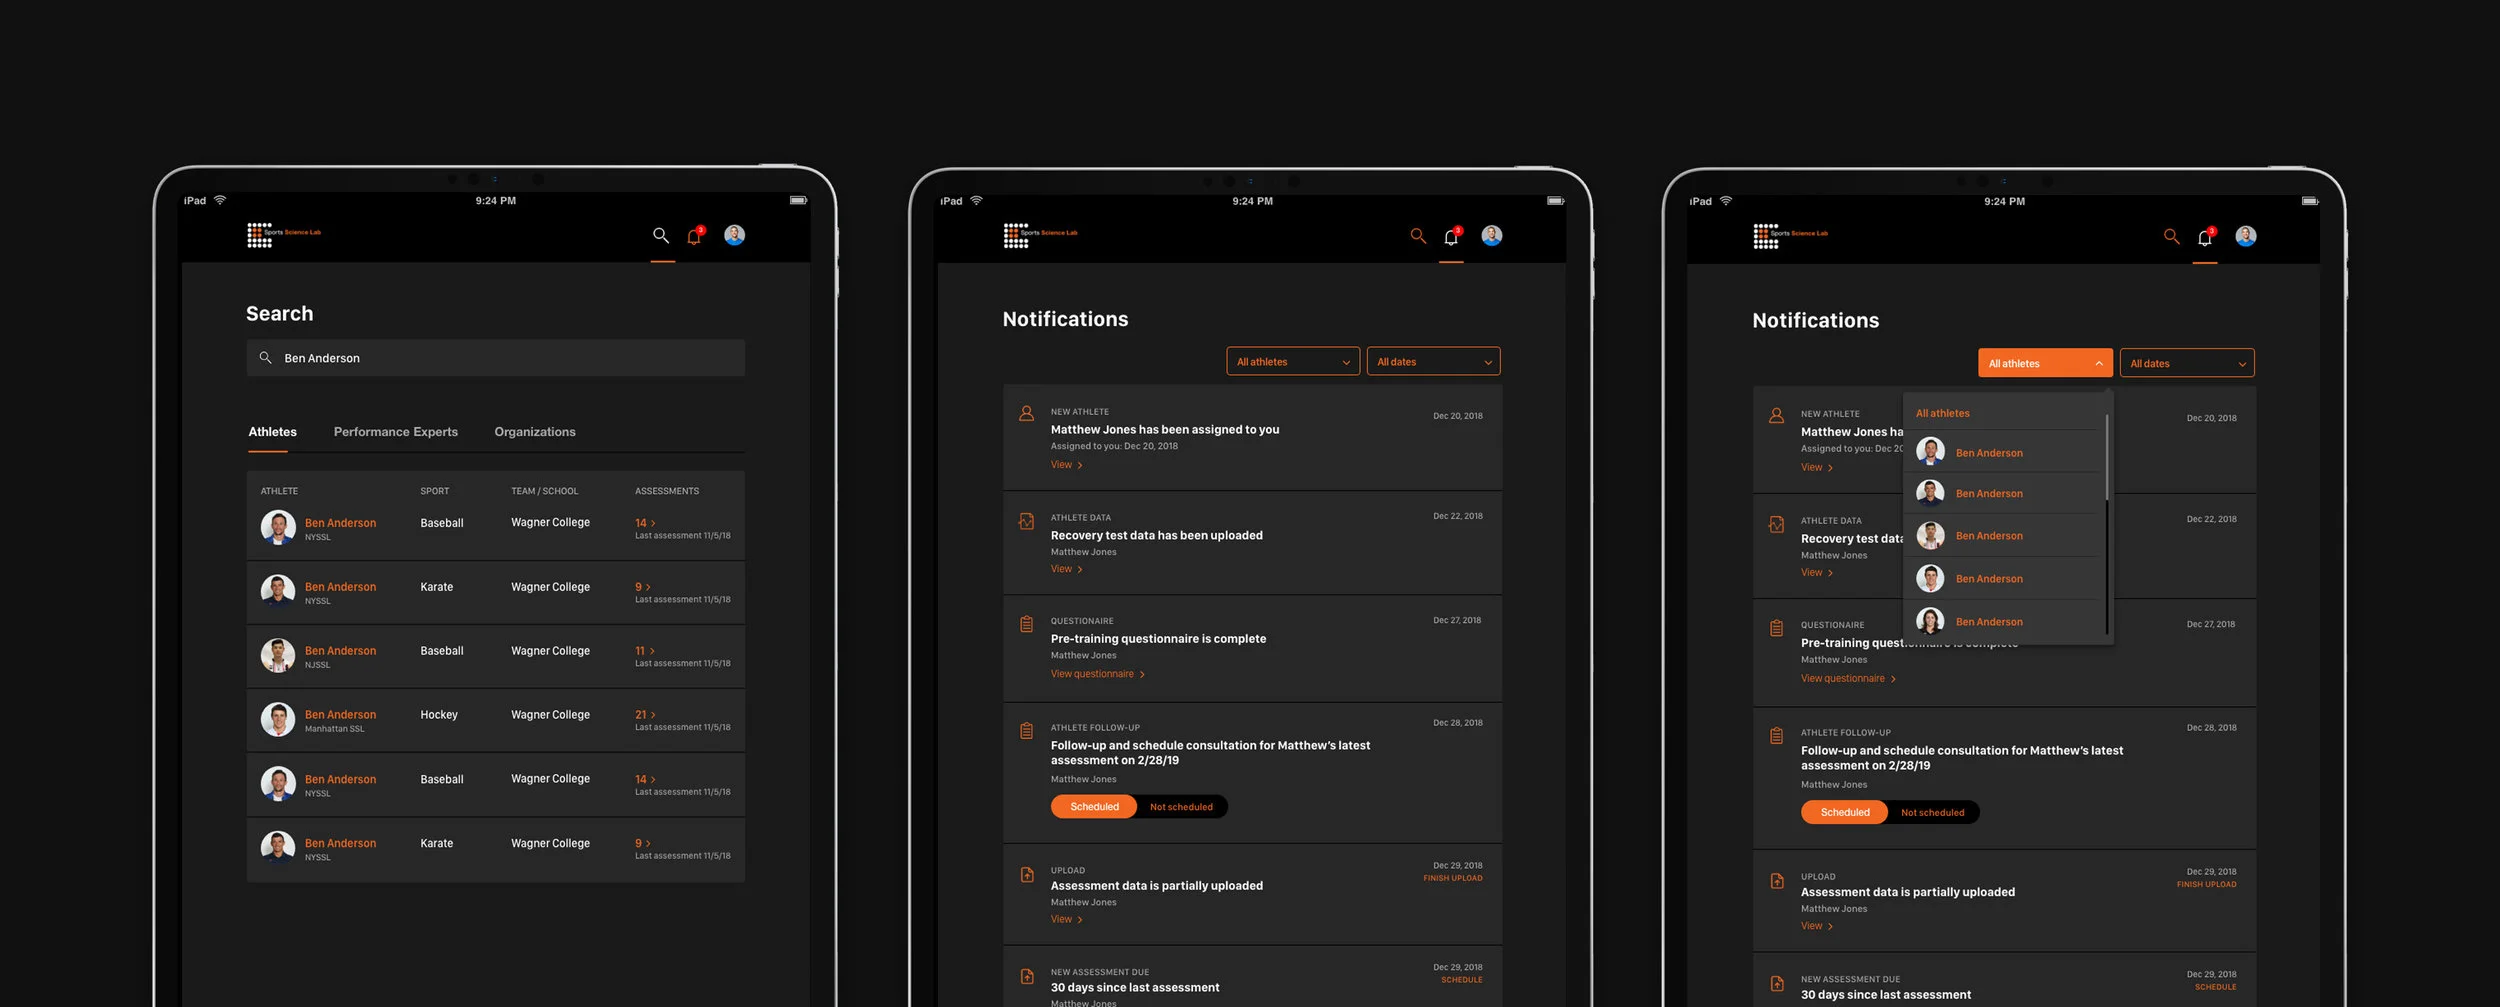
The Performance Expert can search for an athlete, another Performance Expert, or an Organization. Notifications vary in type, and the user can filter by athlete and date.
Mobile App
The top priority for the external app was to display both an athlete’s assessment and daily training data in a way that promotes ease-of-understanding and allows the athlete to take away actionable information.
One of the key challenges for me was to transform intricate data to a mobile experience in a way that could accommodate increasing data, without loosing the product’s simplicity and ease of use. I also wanted to be able to compare data across multiple assessment dates to measure the athlete’s progress and areas of improvement. I began by creating a strict hierarchy and creating options of how to display such detailed data.
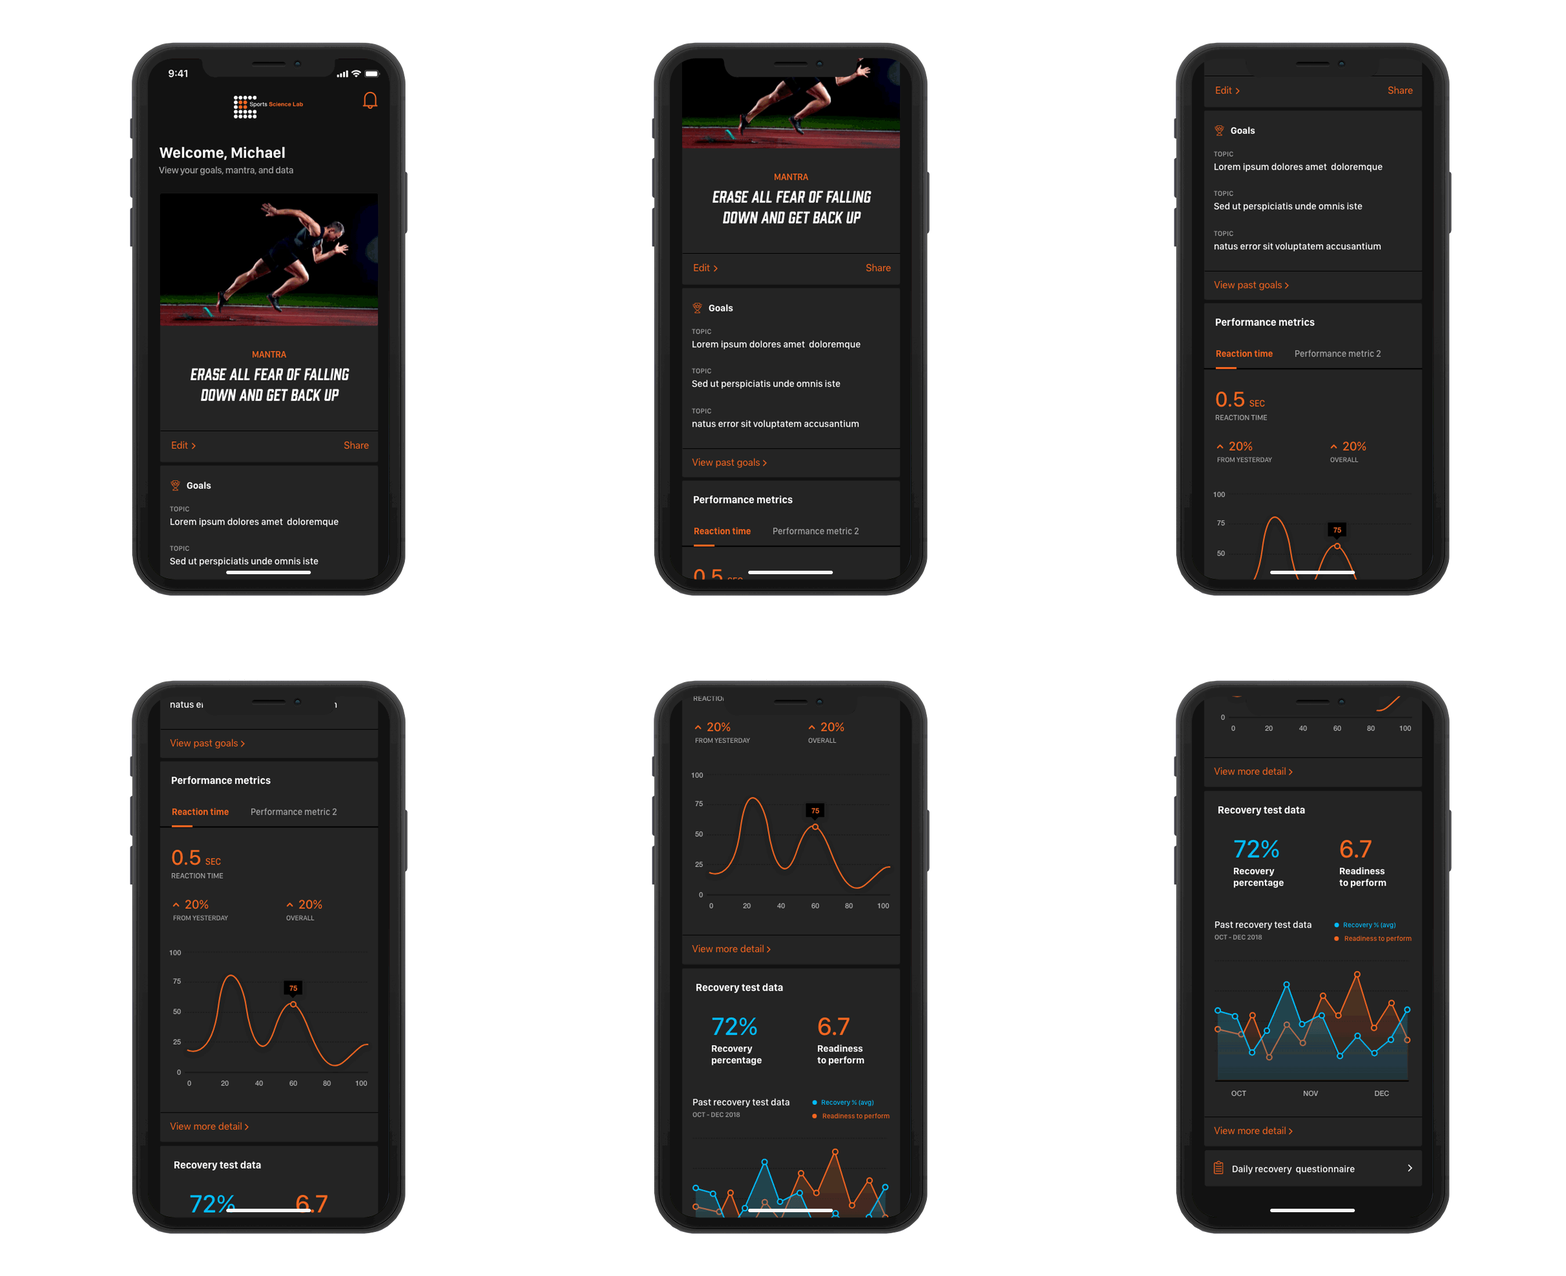
Dashboard
The dashboard let’s athlete’s view information about their performance at a glance. The athlete can view the mantra, goals, performance metrics, and recovery test data. The athlete can edit the mantra from this screen, as well as dive deeper into the performance metric and recovery data.
Goals & Recovery Slider
Each athlete’s goals are very important to propel the athlete forward in training. After each assessment, the athlete gives subjective scores using a slider for how they are feeling. The user can go back and review these goals at any time.
Assessments
Assessments are used to measure the athlete’s ability using multiple different machines. The data extracted from these machines and exercises are then captured in the app.
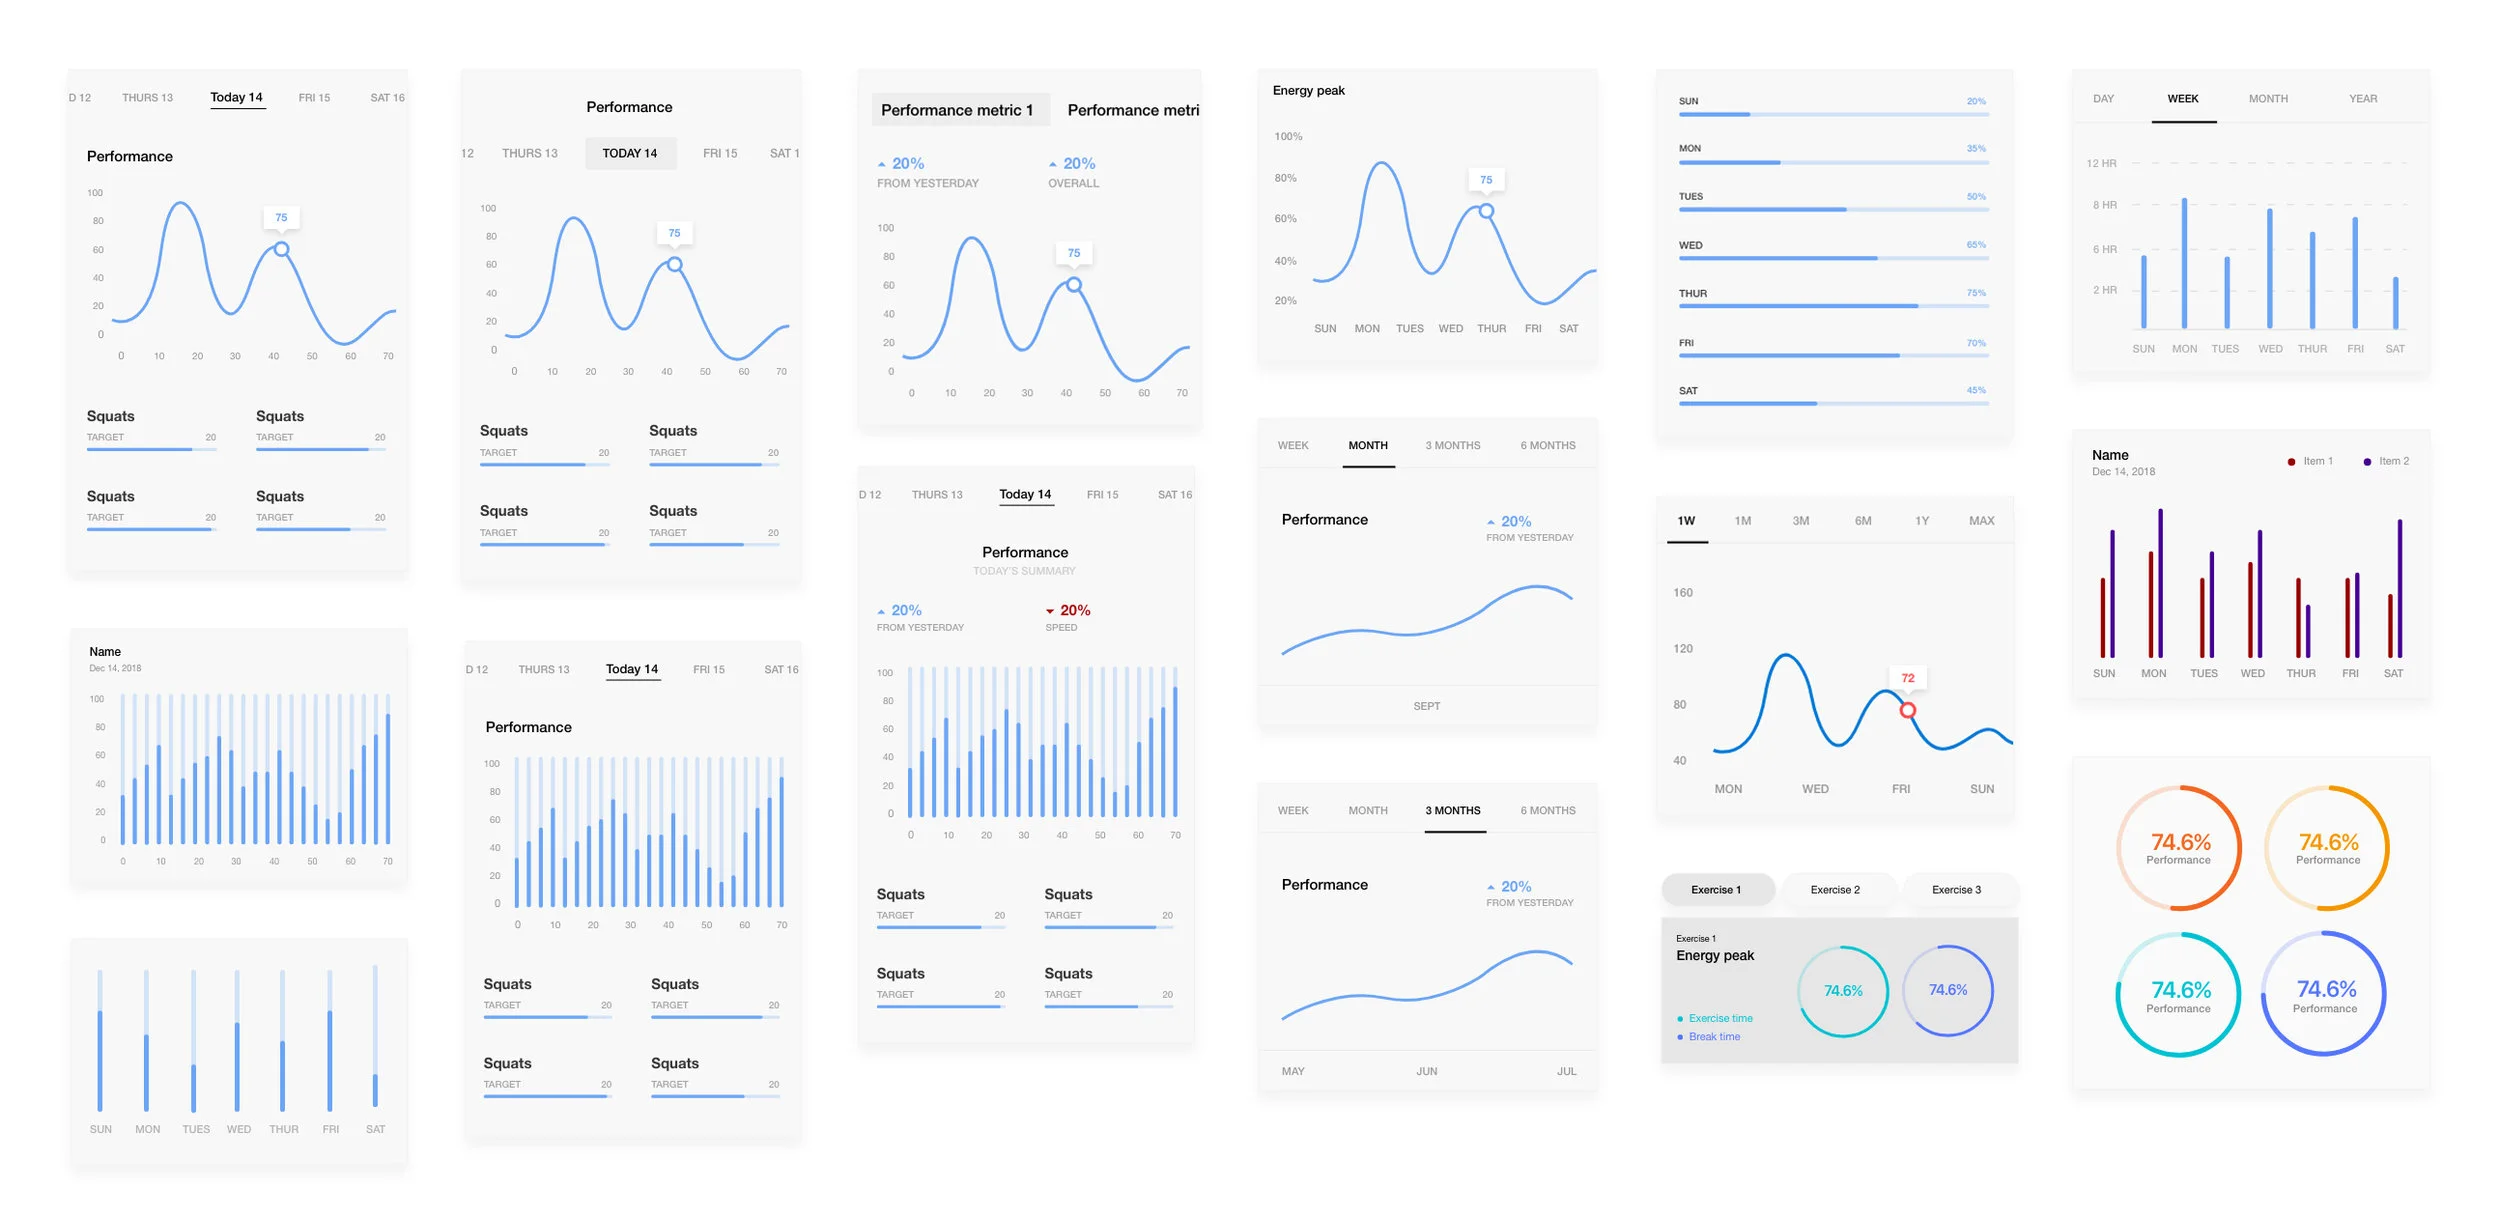
Data Visualization Exploration
This project was very heavy on data visualization and analytics. I began my process by creating different graphs and charts that could fit the data.
Final Data Visualizations
Data visualizations are ideal for understanding data at a glance or in detail. They allow users to view detailed information about their training sessions, as well as monitor their progress.
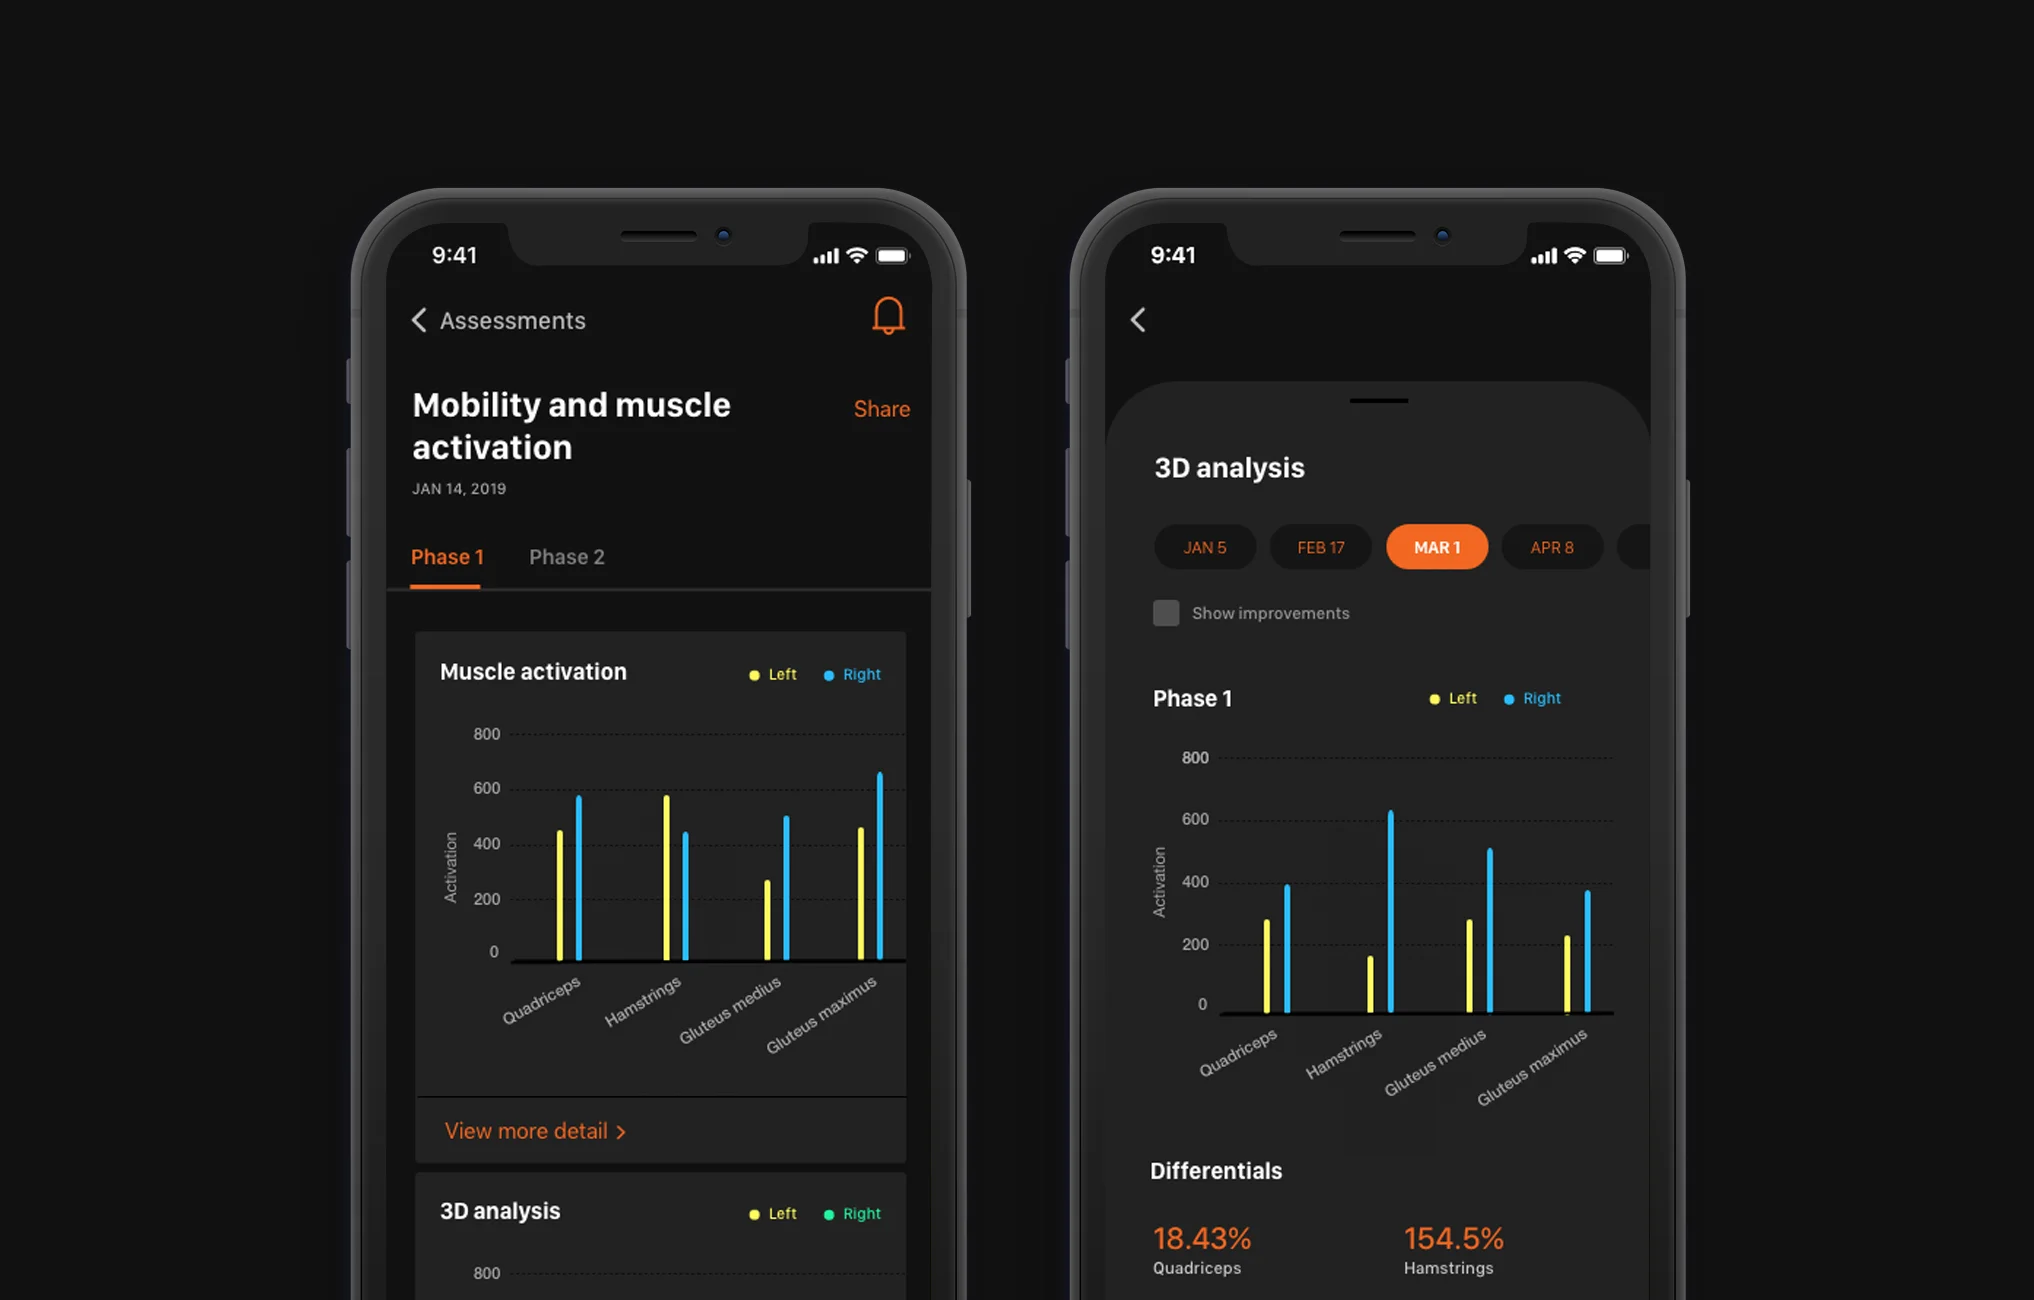
Athletes can dive deeper into each data visualization to analyze the data closer and to compare their progress looking at each assessment session. This allows the athlete to see where they need more improvement and where they are performing well.
Detail Experiences for Data Specifics
If the users wants to know more about a data point, a simple tap takes them to a detail screen where the user can dive into data specifics. The user can pull down the pop-up or click the back arrow to return to the original page.
Profile
The profile section utilizes three links so the users can dive into the area they want to. In addition to accessing their personal information, they can view their performance experts and get in touch with them with one tap.
Notification Iconography
There are six possible notifications for an athlete. The use of iconography allows the user to quickly differentiate between notifications.


